
Paperis Articles
Do Nudges Really Work? — The Power of Defaults and the Fight over the Average Effect
A single pre-checked box changes retirement plan enrollment. Correcting for publication bias took the average effect of nudges from d = 0.43 to 0.04 under one method; the open questions are whether that average is zero or a small positive number, and which nudges work where.
Your field's papers, as audio
Pick your fields and journals — Paperis summarizes the key papers and turns them into audio. Listen on your commute.
Start Paperis free →Do Nudges Really Work? — The Power of Defaults and the Fight over the Average Effect
Your First Week on the Job, a Box Already Checked
A new employee starting at a company in the U.S. receives a stack of paperwork during their first week. Among them is an enrollment form for the company retirement plan—a system known in the U.S. as a 401(k)—which sets aside a portion of one's salary to build a retirement fund. In the past, employees had to actively apply to join. This company changed the rules so that employees were automatically enrolled unless they said nothing and opted out, with only those who did not want it opting out. The percentage to be deducted and the fund to put the money into were also predetermined.

Illustration: Paperis
A 2001 study analyzing automatic enrollment showed that 401(k) participation rates were markedly higher under automatic enrollment. A substantial portion of subscribers who came in through automatic enrollment maintained the contribution rate and fund allocation the company had set. Almost none of the employees who joined before automatic enrollment had chosen that exact combination on their own. The authors suggest that this "status quo bias" stems from inertia and from employees accepting the predetermined combination as investment advice from the company (DOI: 10.1162/003355301753265543). Employees who joined before and after automatic enrollment faced the same set of choices, yet produced different outcomes depending on which option was pre-checked.
The option that is predetermined when nothing is chosen is called the default. The pre-checked box and the predetermined rate and fund in the 401(k) are both defaults.
Choice architecture is the environment itself in which people make choices. Which box on a form is pre-checked and what appears at the top of a menu all fall under this.
Designing the choice environment so that people behave in predictable directions without forbidding anything or using large financial incentives—this is a nudge. American economist Richard Thaler and legal scholar Cass Sunstein introduced this concept in 2008 (DOI: 10.1093/ej/uez054), and nudges subsequently created a major current in behavioral science research (DOI: 10.1073/pnas.2200300119).
The power demonstrated by the retirement pension box is clear. What this article examines is the question that follows. Do the countless interventions bundled under the name of nudges work on average as well? In 2021 and 2022, direct and opposing conclusions on this question appeared in the pages of the Proceedings of the National Academy of Sciences (PNAS). This article follows what each side calculated, and what large-scale experiments actually run by governments show.
How Strong Are Defaults?
Organ donation is a classic case of defaults. Some countries only make people donors if they actively register their consent, while others treat people as donors unless they state otherwise. Behavioral scientists Eric Johnson and Daniel Goldstein reported in a 2003 policy commentary in Science, using a mix of data from real-world systems and experimental data, that this simple difference in defaults has a large effect on donation decisions and significantly raises donation rates (DOI: 10.1126/science.1091721). The authors wrote that defaults can produce surprising differences in preferences, and that those differences lead to substantial economic impacts. In both retirement savings and organ donation, people showed a tendency to stay right where things were pre-arranged.
The evidence on the organ donation side has grown more complicated since then. In a 2026 systematic literature review pooling 13 high-quality studies, the results of opt-out systems varied across countries, and policy effectiveness also differed greatly by country. Beyond laws, public awareness, cultural attitudes, media campaigns, and healthcare infrastructure all influenced donation. The authors concluded that presumed consent may increase post-mortem donation, but is not a universal fix (DOI: 10.1177/17504589251390742). A 2024 preprint analyzing data from countries that switched to this system between 2000 and 2019 reported that post-mortem donors increased by an average of 2.79 per 1 million people, a relative 18%, but living donors decreased by 3.56 per 1 million people, or 62%, making the overall effect effectively zero (DOI: 10.31234/osf.io/c36v8, preprint). The authors explain that under this system, people more strongly believe the organ supply is sufficient, which reduces their willingness to make living donations to strangers. This means that while the behavior targeted by the default increased, other behaviors alongside it may decrease.
There are also studies that focus exclusively on defaults. A meta-analysis is a method that gathers the results of multiple studies addressing the same question and combines them into a single average effect. It stems from the idea that while a single study has a small sample and a specific context, pooling many together will offset those random quirks to some extent. A 2022 meta-analysis gathering 56 papers and 92 studies reported that "opt-out systems" generate more pre-arranged choices than "opt-in systems" (DOI: 10.3724/sp.j.1042.2022.01230).
There are also places where defaults fail. Sunstein himself, who co-introduced the concept of the nudge, pointed out two major reasons defaults fail in a 2016 essay. The first is when the selector has a strong preference from the beginning. In that case, even if the default changes, people choose what they wanted all along. The second is when a "counter-nudge" persuading people in the opposite direction from the other side succeeds (DOI: 10.1017/bpp.2016.3). The abstract of that same 2022 default meta-analysis also notes that there is a series of studies where setting defaults had no effect or even backfired. However, the vast majority of the 92 studies included in this meta-analysis showed positive effects, with only a minority showing no effect or negative effects (DOI: 10.3724/sp.j.1042.2022.01230).
Defaults have the thickest evidence among nudges, but can grow weak in the face of strong preferences and counter-nudges (DOI: 10.36923/ijsser.v8i1.363; DOI: 10.1017/bpp.2016.3). And when asking the question "do nudges work?", defaults are just one category within the large bundle known as nudges.
2021, A Meta-Analysis Gathering All Nudges
In 2021, a meta-analysis gathering over a decade of nudge research was published in PNAS, authored by Mertens and colleagues. The critical question the authors raised was this: while solving challenges like pandemics or climate change requires people to change their behavior, despite nudges being widely used, it was not well understood how effective they are overall or under what conditions they work. The authors concluded that nudges drive behavioral change across major behavioral domains, populations, and regions, and wrote that these results can guide policy decisions based on behavioral science (DOI: 10.1073/pnas.2107346118). In the words of the main text of the paper, nudges were an "effective and widely applicable tool for behavioral change" (DOI: 10.1073/pnas.2200300119).
The magnitude of the average is measured by the effect size. The effect size is the difference between the intervened group and the non-intervened group, measured against the degree to which those measurements are scattered among individuals. Measured this way, a study measuring savings and a study measuring vegetable intake can be placed on the same scale. The number written as d in this article is this effect size. In the table of a critical letter recalculating this meta-analysis data, the overall uncorrected average was d = 0.43. When the interventions were divided into three categories, the "information" category providing information was 0.25, the "structure" category changing the structure of choices was 0.58, and the "assistance" category helping execution was 0.22 (DOI: 10.1073/pnas.2200300119).
There was one catch with this average. Publication bias is a distortion where studies with clear effects are more likely to be published in academic journals than studies with no effects, making the effects look larger than they actually are when only published studies are gathered. Since meta-analyses gather published studies, they inherit this distortion as is. The Mertens research team also reported this distortion. The meta-analysis found "moderate publication bias," and sensitivity analysis showed that if publication bias is severe, the actual effect size could drop as low as d = 0.08. According to the explanation in the critical letter, the Mertens team reported that severe publication bias was only partially supported by the data and subsequently proceeded with most of their analyses without accounting for publication bias (DOI: 10.1073/pnas.2200300119). Whether the true average is closer to 0.43 or closer to 0.08 and below became the center of debate the following year.
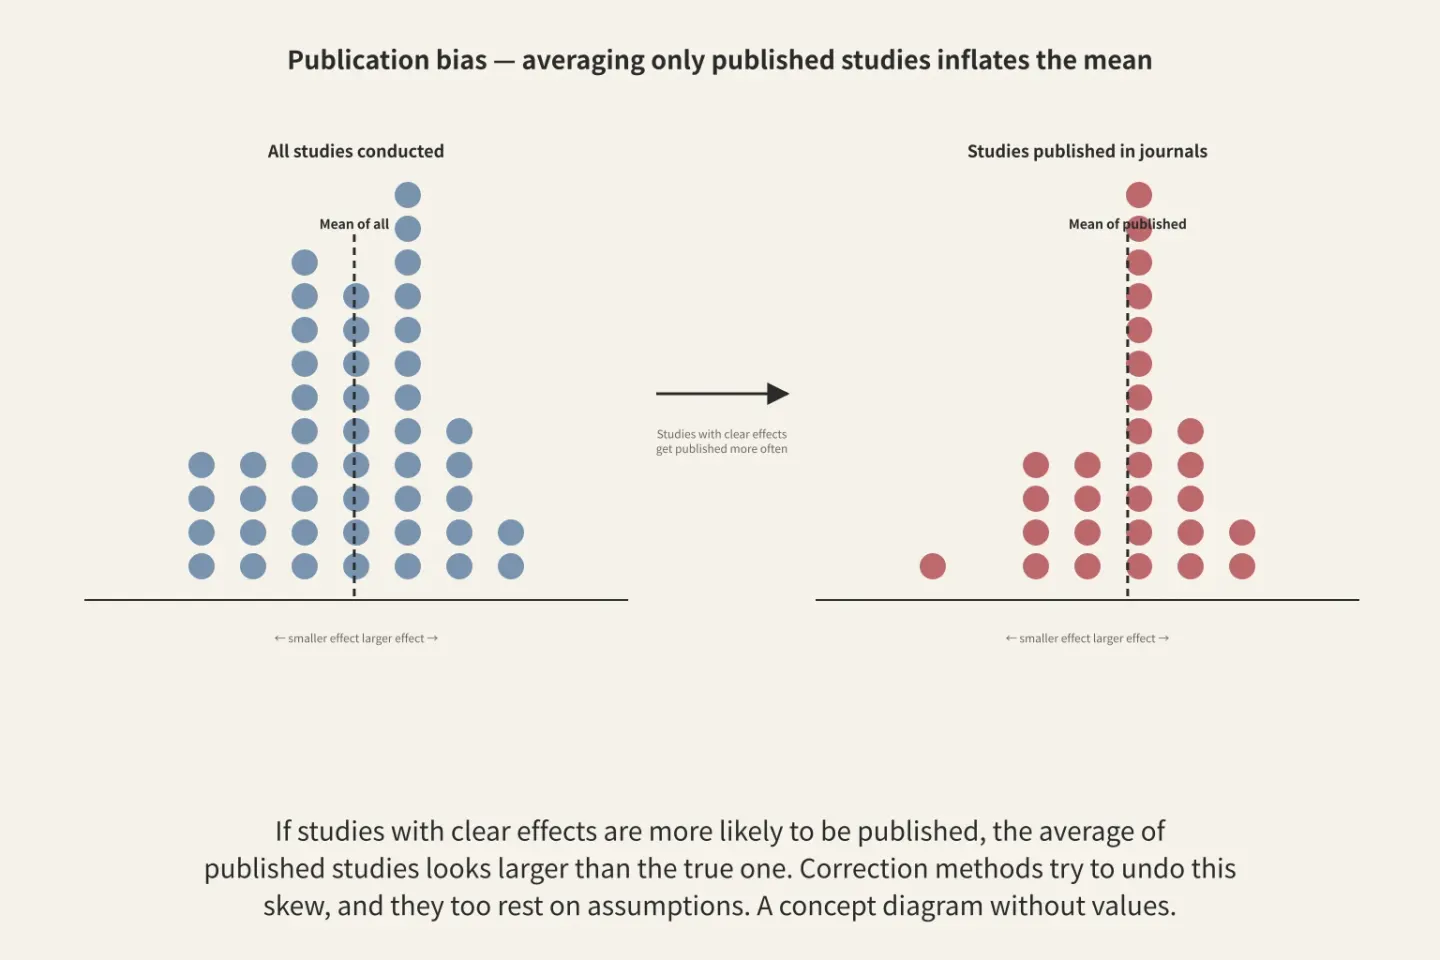
Figure: A diagram drawn by Paperis based solely on the text content
What Remains When Publication Bias Is Stripped Away
The path to bias works like this. In experiments with few participants, even if the same nudge is tested, the results swing wildly based on chance. Some experiments show a large effect, while others hover near zero. If only the side with large effects ends up in academic journals, the effects of the small experiments that do get published will systematically look larger than those of big experiments. That is why methods for detecting publication bias look at the relationship between a study's precision and its effect size. The more a study lacks precision while still showing a large effect, the stronger the signal suspecting bias. The Mertens team also used a method testing this relationship and found significant publication bias, with a test coefficient of 2.10. A critical letter pointed out that this value falls into a "severe" range by existing standards (DOI: 10.1073/pnas.2200300119).
In 2022, Maier and colleagues published a letter in the same PNAS, reaching the opposite conclusion of the Mertens team. The opening of the letter argues that "The real headline is publication bias." They re-analyzed the same data using a correction method that runs multiple correction models at once and then assigns more weight to the model that best explains the actual data (DOI: 10.1073/pnas.2200300119).
The results are as follows. After correction, the overall average dropped from d = 0.43 to 0.04, and the plausible range was 0.00 to 0.14. In this analysis, the overall average was neither decided in favor of there being an effect nor in favor of there being none. In the letter's phrasing, it is the "absence of evidence" for an overall effect. In a second analysis that picked and used only the single most precise estimate from studies with multiple results, the post-correction average was 0.11 (range 0.00–0.24), yielding weak evidence supporting an overall effect (DOI: 10.1073/pnas.2200300119).
The results were split by category. The information category dropped from 0.25 to 0.00, and the support category dropped from 0.22 to 0.01, with both categories yielding evidence supporting the absence of an effect. The structure category dropped from 0.58 to 0.12 (range 0.00–0.43), but the verdict remained undecided. In the analysis using only the most precise estimates, the structure category weakly supported the presence of an effect at 0.23 (range 0.00–0.49), while the information and support categories still pointed to no effect. The body of the letter does not disclose which nudges were contained in each category (DOI: 10.1073/pnas.2200300119).
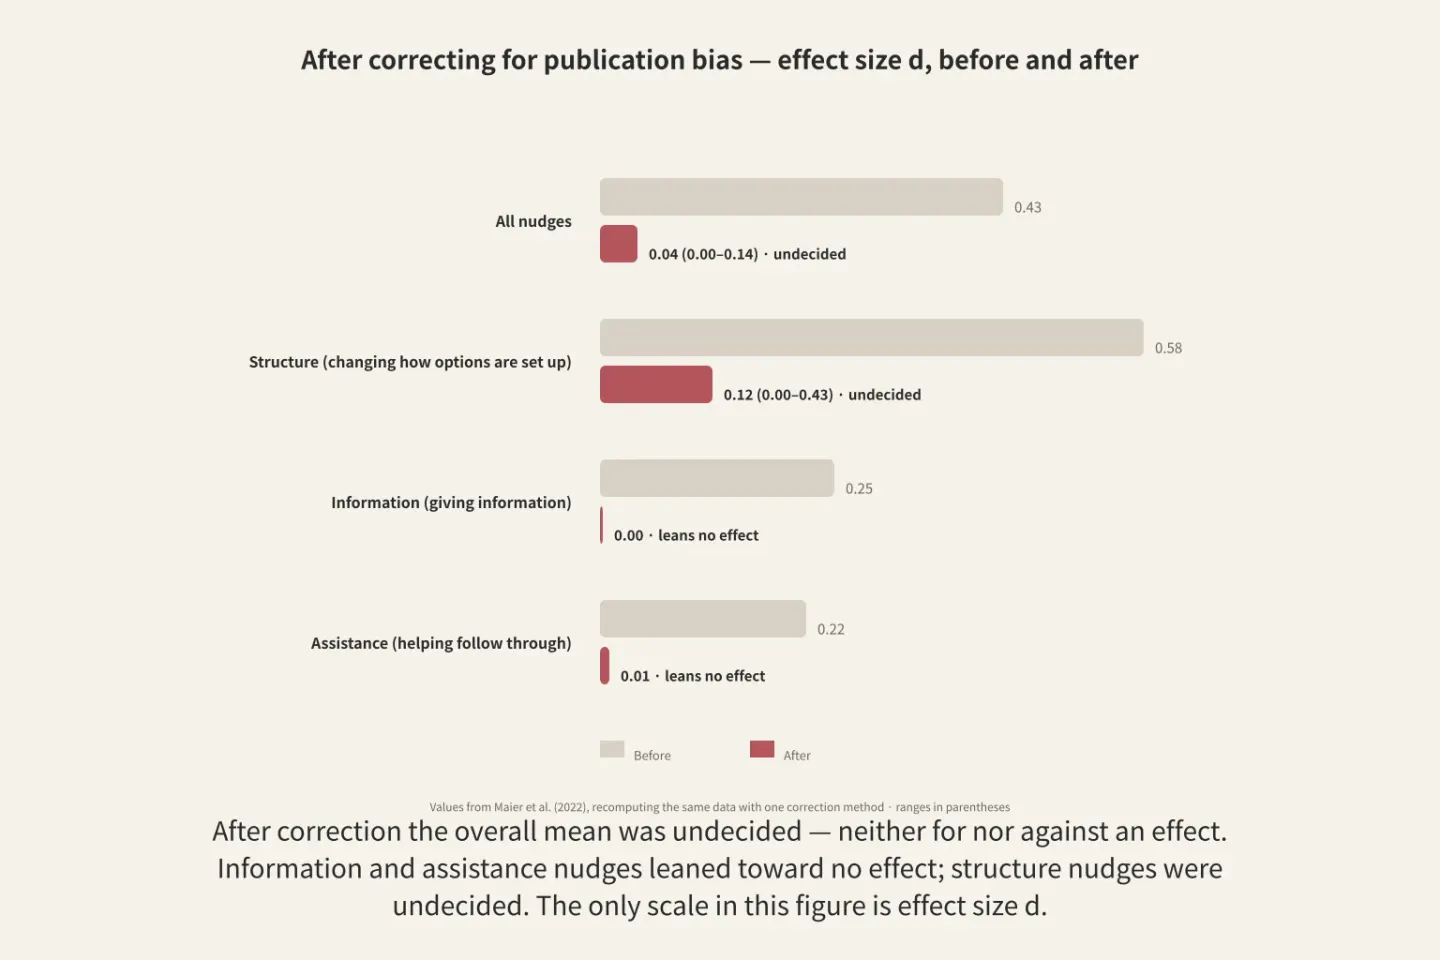
Figure: A diagram drawn by Paperis using only the text of the article
Looking by behavioral domain, in the analysis using only the most precise estimates, most domains yielded evidence for no effect, while the food, pro-social behavior, and other domains remained undecided. For the financial domain, the pre-correction figure of 0.23 dropped to 0.00 post-correction, showing the strongest evidence for no effect in both analyses. Since the letter does not disclose which nudges were included in this domain, these numbers cannot be used to judge auto-enrollment in a 401(k) on their own. The basis for auto-enrollment is a comparison from a 2001 study that matched employees who joined before and after auto-enrollment was introduced. As for publication bias itself, strong evidence emerged across all subdomains in the analysis using only the most precise estimates, once the food domain was excluded (DOI: 10.1073/pnas.2200300119).
The letter also contains results that read differently. Evidence emerged that effect sizes varied across studies in all categories and domains except the financial domain. The authors wrote that this means some nudges can be effective even when there is evidence against an average effect. This caveat is not attached to the financial domain, where there was no evidence of heterogeneity. And in conclusion, they wrote that after correcting for this publication bias, no evidence remains that nudges are effective as behavioral change tools (DOI: 10.1073/pnas.2200300119). The critical letter showed two layers. No evidence supporting an effect remained in the overall average, and evidence even emerged favoring the absence of an effect in the information and support categories as well as several domains. At the same time, the authors wrote that because effects vary across studies, some nudges may be effective.
That same year, PNAS also published a commentary by Szaszi and colleagues. The title is the stance itself. "No reason to expect large and consistent effects of nudge interventions." Because the published abstract consists of just a single sentence stating that their opinion differs from the Mertens team, we carry over only the stance revealed by the title here (DOI: 10.1073/pnas.2200732119). What the title takes issue with is the magnitude and consistency of the effect.
Analyses conducted separately from the letter point in the same direction. A secondary meta-analysis from 2025 re-pooled 14 nudge meta-analyses. This encompasses 1,638 primary studies and approximately 30 million participants. The pooled effect size was d = 0.27, which dropped to d = 0.004 upon adjusting for publication bias. However, the authors noted that because the methodological quality of most of the collected meta-analyses was rated as low or very low, this result inheriting those limitations should be interpreted with caution (DOI: 10.1002/bdm.70053).
There is no single set answer for the correction method either. A 2026 preprint showed through simulation that wrongly assuming effect sizes follow a single normal distribution can heavily skew inferences from standard publication bias correction methods, and illustrated this by applying a new method that splits effect sizes into multiple groups to this nudge meta-analysis. The numerical figures for that application result are not given in the abstract (DOI: 10.31234/osf.io/nkyqm_v3, preprint). This means that any corrected numbers also rest upon the assumptions built into the correction method.
To sum up: The original authors' sensitivity analysis had already left open the possibility that the pre-correction figure of 0.43 was inflated by publication bias, and the critical letter and secondary meta-analysis both yielded values close to zero after correction. There is no analysis within the evidence examined in this article stating that 0.43 is close to the true average. What remains open is whether the post-correction average is truly 0, or whether it is small but greater than 0, much like the 0.11 from the precise-estimate analysis.
Correction — Retracted Papers Had Been Mixed In
In 2022, a correction regarding that meta-analysis was published in PNAS, issued by Mertens and colleagues. According to the correction, the analyzed research sample contained four observations taken from a 2012 paper by Schué and colleagues that was subsequently retracted. Two observations taken from a 2013 paper by Rolfes Dominguez and colleagues had incorrect values entered, and there were coding errors in several other places as well (DOI: 10.1073/pnas.2204059119). Just how much this correction changed the overall average cannot be known from the beginning of the correction alone.
Because a meta-analysis folds multiple studies into a single number, that number can only be trusted as much as the values inside it. The magnitude of the correction cannot be known from the start of the correction, and the correction remains as a record that there were values in the sample that needed to be corrected.
126 Experiments by Government Nudge Units
Nudges have been tested outside of academic journals too. Nudges moved from academic research to large-scale implementation as governments established dedicated units to design and test nudges, so-called nudge units (DOI: 10.3982/ECTA18709). Randomized controlled trials are experiments where people are randomly divided like a draw to receive an intervention on one side only, and the results of the two groups are compared.
Economist Stefano DellaVigna and policy scientist Elizabeth Linos collected all randomized controlled trials run by two of the largest nudge units in the United States, totaling 126. The number of participants was 23 million. Because they gathered every single experiment from the two units, this sample was not filtered by whether it was published in an academic journal. They then compared these experiments with journal nudge experiments published in two recent meta-analyses (DOI: 10.3982/ECTA18709).
In journal papers, the average effect of nudges was very large. The proportion of people participating in the target behavior, in other words the participation rate, rose by 8.7 percentage points, which was a level 33.4% higher than the control group's average participation rate. In the nudge unit experiments, the average effect was a 1.4 percentage point increase, an 8.0% increase compared to the control group. The authors wrote that while this value is smaller than in journals, it remains substantial and statistically very significant (DOI: 10.3982/ECTA18709). Percentage points express how many steps the ratio itself moved, while % expresses in ratio terms how much it grew compared to the original ratio. And because both numbers are different scales from the $d$ we saw earlier, 8.7 or 1.4 cannot be placed side by side with 0.43 or 0.04 to compare their sizes.
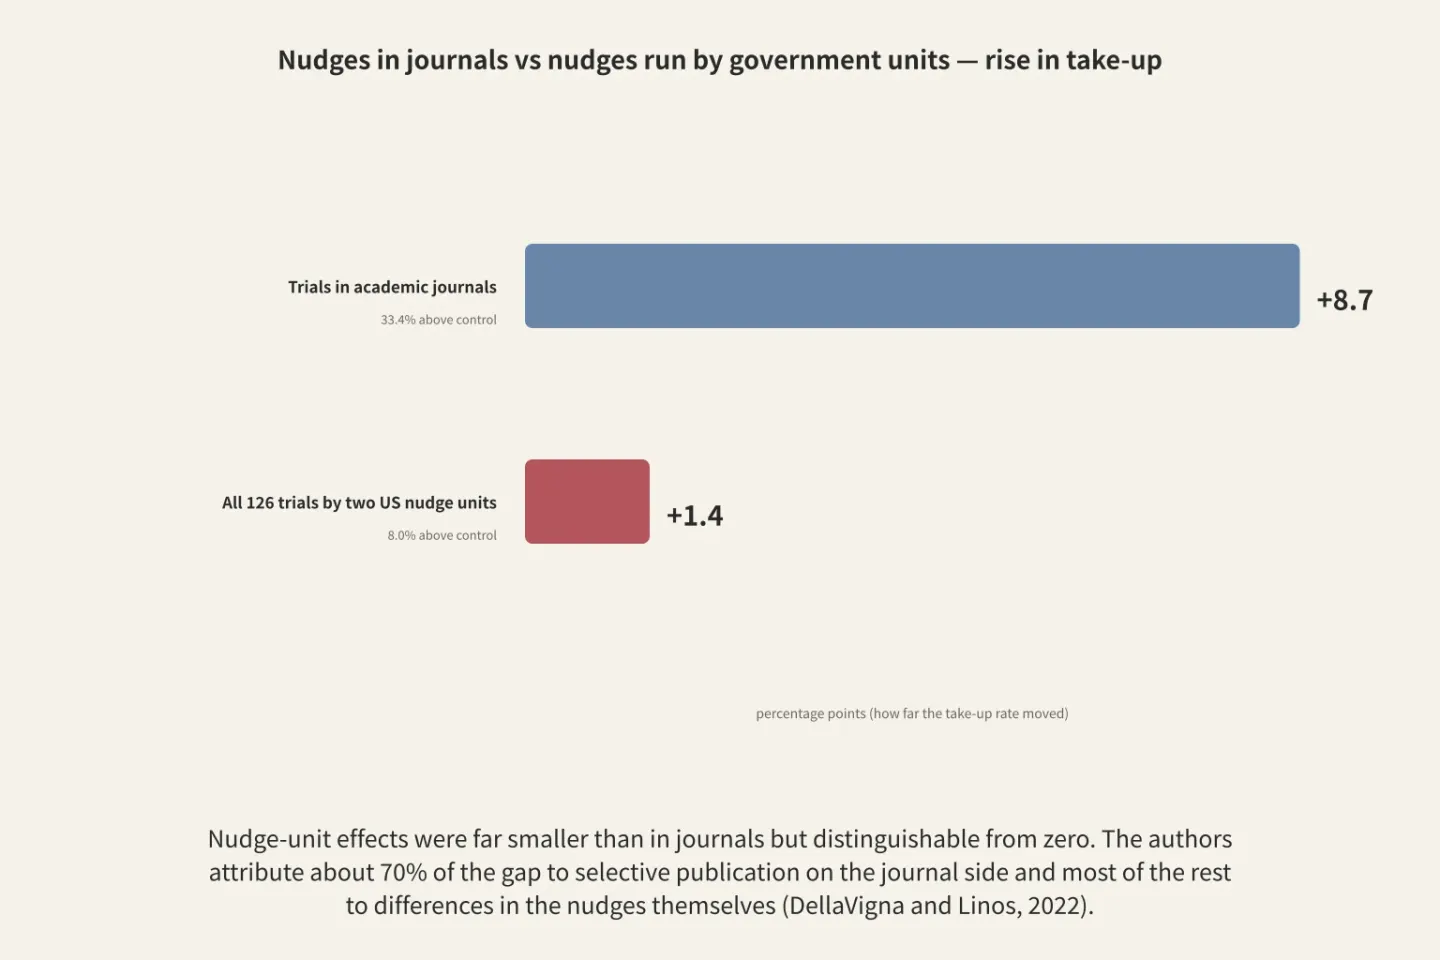
Figure: A diagram drawn by Paperis using only the main text
Why did the difference occur? The authors pointed out three things. The point that the experiment scale was small so the power to catch effects was weak, the point that intervention characteristics like the covered topics and behavioral pathways differed, and the point that studies with good results were selectively published. In a model incorporating these three factors, the selective publication of the journal sample grew larger due to the small sample size, explaining about 70% of the difference between the two samples, and most of the remaining difference was explained by differences in nudge characteristics (DOI: 10.3982/ECTA18709).
Even in government experiments not filtered by publication, the average effect of nudges was much smaller than in journals, but distinct from 0. This result overlaps on one part with both sides of the preceding debate. It goes in the same direction as the critical letters in that journal numbers had been inflated by selective publication, and in a different direction in that the effect remained in the field as well. The two studies differ in both their samples and their measurement scales.
Whether a small effect is useful as a policy must be weighed alongside its costs. In 2017, Benartzi and colleagues calculated cost-effectiveness ratios for nudges and traditional policy tools like tax incentives, and reported that nudges often performed well compared to traditional tools (DOI: 10.1177/0956797617702501). Concluding that nudges should be used more often alongside traditional policies, the authors added that further calculations are needed to judge relative effectiveness. In a 2024 meta-analysis gathering nudges trying to change physicians' prescriptions, only 7 out of 21 studies evaluated costs, and those studies found them cost-effective but only looked at direct effects. In this meta-analysis, 62 out of 85 outcomes (73%) were statistically significant. The authors concluded that nudges can be effective in guiding prescription decisions, but the effects are small, health effects and cost-effectiveness are unclear, and they also reported evidence of publication bias (DOI: 10.1177/0272989x241270001).
Nudges That Don't Work or Backfire
Sunstein listed five additional reasons why nudges may not work as expected, beyond default options. There are nudges that confuse the target audience, and nudges whose effects end quickly. Nudges that provoke resistance exist, but he noted they seem rare. There are nudges where the designer misjudged what would move people, and nudges where people take counteractions elsewhere that offset the effect (DOI: 10.1017/bpp.2016.3).
Such scenes also appeared in actual experiments. There is an experiment that randomly divided 18,043 online open course students, giving one side a nudge to try making their own study schedule. There was no effect on near-term participation, and a weakly significant negative effect on long-term participation, completion, and grades. This negative effect was concentrated in two groups: students who registered close to the start date and students using university email addresses. The authors concluded that interventions with theoretical grounds can also entangle with students' differing motivations and unexpected ways (DOI: 10.1177/2332858416674007).
A 2025 meta-analysis gathering 33 field experiments that tried to reduce meat consumption in institutional catering and restaurant settings shows both sides of nudges together. The effects varied drastically across studies. Among the dispersion of results, the share not explained by chance and appearing to be differences between studies was 99.97%, and the prediction interval—the range where the effect of a new intervention is likely to fall—spanned from −50% to +28% in the rate of change in meat consumption, meaning it ranged from greatly reducing it to actually increasing it. The authors therefore wrote that a single average can be misleading. Within that, interventions changing the structure of choices reduced meat consumption by up to 30%, and among them, default options reduced it by an average of 54% (the abstract's summary points note "up to 54%"). On the other hand, strategies providing information or helping decisions had no effect. And about 30% of the interventions had the adverse effect of actually increasing meat consumption. The authors viewed that this proportion is higher than in some previous meta-analyses, which may be due to less controlled field environments or psychological reactance (DOI: 10.1016/j.jenvp.2025.102830). Here, 54% is the reduction rate of meat consumption, so it is also a different scale from d or percentage points.
Even when nudges are piled on top of each other, the effects may not add up. In an experiment giving 316 UK residents electricity usage information for 16 weeks, both the group given only their own home's usage and the group given that alongside the average of other homes in the area saw consumption decrease by about 3%. The group that received neighbor comparison information was significantly more likely to look closely at the information, but there was no additional effect on consumption (DOI: 10.1108/ejm-10-2011-0568).
Whether effects last long also differs by nudge. In 38 natural field experiments covering widely used energy-saving nudges, half of the energy savings remained in the house even after the original occupant moved away and the nudge stopped. The authors saw this persistence as aligning with the pathway of acquiring new appliances (DOI: 10.1093/restud/rdag012). This means there is a path where effects remain even after the nudge stops, and the authors found that path on the appliance side. A 2025 review comparing ten health-sector nudge studies showed a similar divide. There was a tendency for effects to diminish once the intervention ended, especially with economic incentives, but default options appeared to be maintained over time (DOI: 10.1016/j.gaceta.2025.102468).
Back in Front of That Checked Box
Let's return to the employee in their first week. If they leave the box as it is, savings begin according to the rate and fund determined by the company. A 2001 study showed that many employees left it as it is, and the reasons appeared to be inertia and the perception of a "company-recommended combination" (DOI: 10.1162/003355301753265543). This box is the default, which has the strongest evidence among nudges (DOI: 10.36923/ijsser.v8i1.363). In a 2022 meta-analysis consisting solely of defaults, the opt-out format produced more pre-set choices than the opt-in format, with an effect size of d = 0.59. In the same meta-analysis, the effect was larger in Western cultures than in Eastern cultures; by domain, it was largest in consumer choices, while the health domain was the weakest, though the difference was not statistically significant (DOI: 10.3724/sp.j.1042.2022.01230). The authors reported that this value is slightly lower than the preceding 2022 meta-analysis from 2018, but still a medium-sized effect, and concluded that default nudges are genuinely effective for behavioral change. The abstract of this meta-analysis contains no mention of publication bias correction. Therefore, 0.59 sits on the same line as the pre-correction 0.43 from the Mertens meta-analysis. The "Structure" category, where the pre-correction value was similar at 0.58 in the table of the critical letter, dropped to 0.12 after correction and was left unresolved. However, the letter did not clarify whether defaults were included in that category (DOI: 10.1073/pnas.2200300119).
However, if this employee has a strong preference—for example, if they clearly think this account is unnecessary because they are already saving for retirement elsewhere—this is where the first reason for failure cited by Sunstein applies (DOI: 10.1017/bpp.2016.3). Even with the same box, its power can vary depending on who is standing in front of it.
So, do nudges really work? Based on the evidence so far, this is about all that can be answered. Defaults have a record of large effects in specific settings such as retirement pensions and cafeteria lines. For organ donation, results have varied by country, and there is an analysis (preprint) suggesting that live donations decreased, causing the overall effect to disappear. Regarding the average of nudges as a whole, the original authors' sensitivity analysis left open the possibility that the pre-correction figure of 0.43 was inflated by publication bias, and a critical letter, a secondary meta-analysis, and a comparison of government experiments all yielded results in the same direction. The open question is whether the post-correction average is zero, or small but greater than zero. Government experiments, which are not filtered by publication, yielded effects much smaller than those in academic journals but distinguishable from zero.
Gathering the numbers from this article in one place yields the following. Numbers with different scales cannot be directly compared in magnitude.
| Analysis | What was collected | Scale | Value |
|---|---|---|---|
| Mertens et al. meta-analysis, pre-correction | Nudge studies in academic literature | Effect size d | 0.43 (DOI: 10.1073/pnas.2200300119) |
| Meyer et al. letter, post-correction | The same data | Effect size d | 0.04, or 0.11 when using only the most precise estimates (DOI: 10.1073/pnas.2200300119) |
| Secondary meta-analysis, pre-correction → post-correction | 14 nudge meta-analyses | Effect size d | 0.27 → 0.004 (DOI: 10.1002/bdm.70053) |
| Default meta-analysis, pre-correction (no mention of correction in abstract) | 92 default studies | Effect size d | 0.59 (DOI: 10.3724/sp.j.1042.2022.01230) |
| DellaVigna and Linos, academic journal sample | Academic journal experiments from two meta-analyses | Percentage point participation rate | 8.7 (DOI: 10.3982/ECTA18709) |
| DellaVigna and Linos, nudge units | All 126 experiments from two units | Percentage point participation rate | 1.4 (DOI: 10.3982/ECTA18709) |
| Meat consumption nudge meta-analysis, default | Cafeteria and restaurant field experiments | Meat consumption reduction rate | Average 54% (key point phrasing "up to 54%") (DOI: 10.1016/j.jenvp.2025.102830) |
These pieces of evidence point to one common thing: The effectiveness of nudges varies greatly from nudge to nudge and from setting to setting, and in the comparison of two U.S. nudge units, the numbers published in academic journals were larger than those from government field experiments. Therefore, both "nudges work" and "nudges don't work" are statements that load too much onto a single average. The critical letter found evidence that effects vary across studies (DOI: 10.1073/pnas.2200300119), the meat consumption meta-analysis showed that the prediction interval for the effect ranged from large reductions to even increases (DOI: 10.1016/j.jenvp.2025.102830), and the nudge unit study concluded that differences in nudge characteristics account for most of the remaining gap (DOI: 10.3982/ECTA18709).
The questions that remain open are also clear. Which nudges work for which people in which settings cannot be answered by a single average. A 2026 literature review summarizing nudges in finance and public policy identified defaults, simplified procedures, and the presentation of salient information as structuring decision environments that reduce cognitive burden, while noting that effects vary by context, are uneven across groups, and sometimes do not last. This review concluded that nudge effectiveness cannot be assumed to be universal, and that the ethical justification of nudges depends on transparency, proportionality, and accountability. It also noted that personalized and digital nudges bring added concerns regarding algorithmic opacity, privacy, and the potential for manipulation (DOI: 10.36923/ijsser.v8i1.363). The prescription nudge meta-analysis examined earlier recommended that future research evaluate effect heterogeneity, cost-effectiveness, and health outcomes, and pre-register study plans to reduce publication bias (DOI: 10.1177/0272989x241270001).
Whom nudges are used for is also an open question. A 2019 theoretical model considered situations where policymakers' preferences do not always align with individuals' interests, and showed that there are conditions where policymakers choose not to use "boosts"—which build people's capacity to overcome biases on their own—specifically to leave room for using nudges later. The authors noted that under these conditions, boosts would immediately benefit both policymakers and individuals (DOI: 10.1093/ej/uez054). This result comes from a theoretical model without empirical data. Still, it demonstrates that alongside the question of whether nudges are effective stands the question of toward whose goals that effectiveness is directed.
Source Papers
- "The Power of Suggestion: Inertia in 401(k) Participation and Savings Behavior" (2001) — DOI: 10.1162/003355301753265543 — Under automatic enrollment, 401(k) participation rates are markedly higher, and a significant fraction maintains default contribution rates and fund allocations. This occurs because people perceive inertia and default settings as investment advice.
- "Do Defaults Save Lives?" (2003) — DOI: 10.1126/science.1091721 — Policy commentary. Natural and experimental data show that organ donation defaults exert a large effect on donation decisions and significantly raise donation rates.
- "Nudge Versus Boost: Agency Dynamics Under Libertarian Paternalism" (2019) — DOI: 10.1093/ej/uez054 — Theoretical model. Starting from the nudge concept by Thaler and Sunstein (2008), it derives conditions under which policymakers choose not to use boosts to preserve room for nudges.
- "The effectiveness of nudging: A meta-analysis of choice architecture interventions across behavioral domains" (2021) — DOI: 10.1073/pnas.2107346118 — Aggregating a decade of research, it concludes that nudges drive behavioral change across domains, populations, and regions.
- "No evidence for nudging after adjusting for publication bias" (2022) — DOI: 10.1073/pnas.2200300119 — Letter. Pre-correction $d = 0.43$ shifts to 0.04 (0.00 to 0.14) after Bayesian correction; information and support categories show evidence of no effect, structure remains inconclusive, and heterogeneity evidence suggests some nudges may work. Conclusion: no evidence of effect remains after correction.
- "No reason to expect large and consistent effects of nudge interventions" (2022) — DOI: 10.1073/pnas.2200732119 — Commentary. Differences in perspective with the Mertens meta-analysis (abstract is one sentence).
- "Correction for Mertens et al." (2022) — DOI: 10.1073/pnas.2204059119 — Retracted four data points from Shu et al. (2012), two miscoded items from Rolfe et al. (2013), and various coding errors.
- "Addressing Heterogeneity with Bayesian Meta-Analytic Mixture Modelling" (2026) — DOI: 10.31234/osf.io/nkyqm_v3 — Preprint. Assuming a single normal distribution can distort standard publication bias corrections; applied as an example to nudge meta-analyses.
- "Nudging effect of default options: A meta-analysis" (2022) — DOI: 10.3724/sp.j.1042.2022.01230 — Across 92 studies, opt-out increases default choices relative to opt-in ($d = 0.59$), Western > Eastern, health domain is weakest (non-significant), and most studies show positive effects, no effect, or counter-effects in small numbers.
- "Impact of opt-in versus opt-out organ donation legislation on donation rates: A systematic review" (2026) — DOI: 10.1177/17504589251390742 — 13 high-quality studies. Opt-out results vary by country; it can increase post-mortem donation but is not a silver bullet.
- "Negative Spillover Effects of Opt-out Defaults: Evidence from Organ Donation Policies" (2024) — DOI: 10.31234/osf.io/c36v8 — Preprint. Following a shift to opt-out, post-mortem donation increases by +18%, living donation drops by −62%, and net effect is roughly zero.
- "Assessing Nudge Impact: A Comprehensive Second-Order Meta-Analysis" (2025) — DOI: 10.1002/bdm.70053 — 14 meta-analyses, $d = 0.27$ becomes 0.004 after correction for publication bias, with most target meta-analyses rated low or very low in quality.
- "Nudges That Fail" (2016) — DOI: 10.1017/bpp.2016.3 — Essay. Two reasons for default failure (strong prior preferences and counter-nudges) alongside five additional reasons.
- "RCTs to Scale: Comprehensive Evidence From Two Nudge Units" (2022) — DOI: 10.3982/ECTA18709 — 126 experiments and 23 million people. Academic journals report 8.7 percentage points (33.4%) versus nudge units at 1.4 percentage points (8.0%), with selective publication explaining roughly 70% of the difference.
- "Should Governments Invest More in Nudging?" (2017) — DOI: 10.1177/0956797617702501 — In cost-effectiveness ratios, nudges frequently compare favorably to traditional tools, though further calculation is required.
- "The Use of Nudge Strategies in Improving Physicians' Prescribing Behavior" (2024) — DOI: 10.1177/0272989x241270001 — 73% of results are significant. It can be effective for prescribing decisions, but effects are small, health impacts and cost-effectiveness are unclear, and there is evidence of publication bias.
- "A Randomized Experiment Testing the Efficacy of a Scheduling Nudge in a MOOC" (2016) — DOI: 10.1177/2332858416674007 — 18,043 participants, no short-term effect, weak negative effects on long-term participation, completion, and grades.
- "Nudging meat off the plate in foodservice?" (2025) — DOI: 10.1016/j.jenvp.2025.102830 — 33 field experiments. Extreme heterogeneity ($I^2 = 99.97%$, prediction interval −50% to +28%, where a single average can mislead). Structural interventions reduce consumption by up to 30%, defaults by an average of 54% (key takeaway summarized as "up to 54%"), information and decision support show no effect, and roughly 30% of interventions backfire.
- "Is social norms marketing effective? A case study in domestic electricity consumption" (2013) — DOI: 10.1108/ejm-10-2011-0568 — 316 participants in the UK, both feedback types reduce consumption by about 3%, with social norm information yielding no additional effect.
- "Do The Effects of Nudges Persist? Theory and Evidence from 38 Natural Field Experiments" (2026) — DOI: 10.1093/restud/rdag012 — Half of the energy savings persist even after the nudge is removed, aligning with technology adoption pathways.
- "Healthy nudges: exploring their variability, limitations, and future challenges" (2025) — DOI: 10.1016/j.gaceta.2025.102468 — Case study comparing 10 health nudges. Effects tend to decline after interventions end (particularly for economic incentives), whereas defaults appear to persist.
- "Nudge Theory in Finance and Public Policy: A Review of Evidence, Policy Applications, and Controversies" (2026) — DOI: 10.36923/ijsser.v8i1.363 — Narrative review. Evidence is strongest within structured decision environments, and effects are context-dependent and cannot be assumed to be universal.
Sources (22)
- The Power of Suggestion: Inertia in 401(k) Participation and Savings BehaviorDOI 10.1162/003355301753265543
- Do Defaults Save Lives?DOI 10.1126/science.1091721
- Nudge Versus Boost: Agency Dynamics Under Libertarian PaternalismDOI 10.1093/ej/uez054
- The effectiveness of nudging: A meta-analysis of choice architecture interventions across behavioral domainsDOI 10.1073/pnas.2107346118
- No evidence for nudging after adjusting for publication biasDOI 10.1073/pnas.2200300119
- No reason to expect large and consistent effects of nudge interventionsDOI 10.1073/pnas.2200732119
- Correction for Mertens et alDOI 10.1073/pnas.2204059119
- Addressing Heterogeneity with Bayesian Meta-Analytic Mixture ModellingDOI 10.31234/osf.io/nkyqm_v3
- Nudging effect of default options: A meta-analysisDOI 10.3724/sp.j.1042.2022.01230
- Impact of opt-in versus opt-out organ donation legislation on donation rates: A systematic reviewDOI 10.1177/17504589251390742
- Negative Spillover Effects of Opt-out Defaults: Evidence from Organ Donation PoliciesDOI 10.31234/osf.io/c36v8
- Assessing Nudge Impact: A Comprehensive Second-Order Meta-AnalysisDOI 10.1002/bdm.70053
- Nudges That FailDOI 10.1017/bpp.2016.3
- RCTs to Scale: Comprehensive Evidence From Two Nudge UnitsDOI 10.3982/ecta18709
- Should Governments Invest More in Nudging?DOI 10.1177/0956797617702501
- The Use of Nudge Strategies in Improving Physicians' Prescribing BehaviorDOI 10.1177/0272989x241270001
- A Randomized Experiment Testing the Efficacy of a Scheduling Nudge in a MOOCDOI 10.1177/2332858416674007
- Nudging meat off the plate in foodservice?DOI 10.1016/j.jenvp.2025.102830
- Is social norms marketing effective? A case study in domestic electricity consumptionDOI 10.1108/ejm-10-2011-0568
- Do The Effects of Nudges Persist? Theory and Evidence from 38 Natural Field ExperimentsDOI 10.1093/restud/rdag012
- Healthy nudges: exploring their variability, limitations, and future challengesDOI 10.1016/j.gaceta.2025.102468
- Nudge Theory in Finance and Public Policy: A Review of Evidence, Policy Applications, and ControversiesDOI 10.36923/ijsser.v8i1.363