Paperis Articles
A Century of Big Bang Cosmology — A Universe That Gained a Beginning, and Rulers That Still Disagree
A hundred years in which a universe thought eternal and still came to expand, gained a hot beginning, and then turned out to be accelerating — and how certain each of today's three cracks really is: the Hubble tension, JWST's early galaxies, and DESI's dark-energy signal.
Your field's papers, as audio
Pick your fields and journals — Paperis summarizes the key papers and turns them into audio. Listen on your commute.
Start Paperis free →A Century of Big Bang Cosmology — A Universe That Gained a Beginning, and Rulers That Still Disagree
1917, an Eternal and Quiet Universe
In 1915, the German-born physicist Albert Einstein completed general relativity, a new theory of gravity, and in 1917 he presented the first model of the entire universe using this theory (arXiv:2511.06018). At the time, the universe astronomers knew was effectively just our Milky Way, and the stars seemed to stay mostly in place. The picture held by most physicists then was that the universe always stays the same, with no beginning and no end. Einstein's first model was also a static universe that does not change over time.
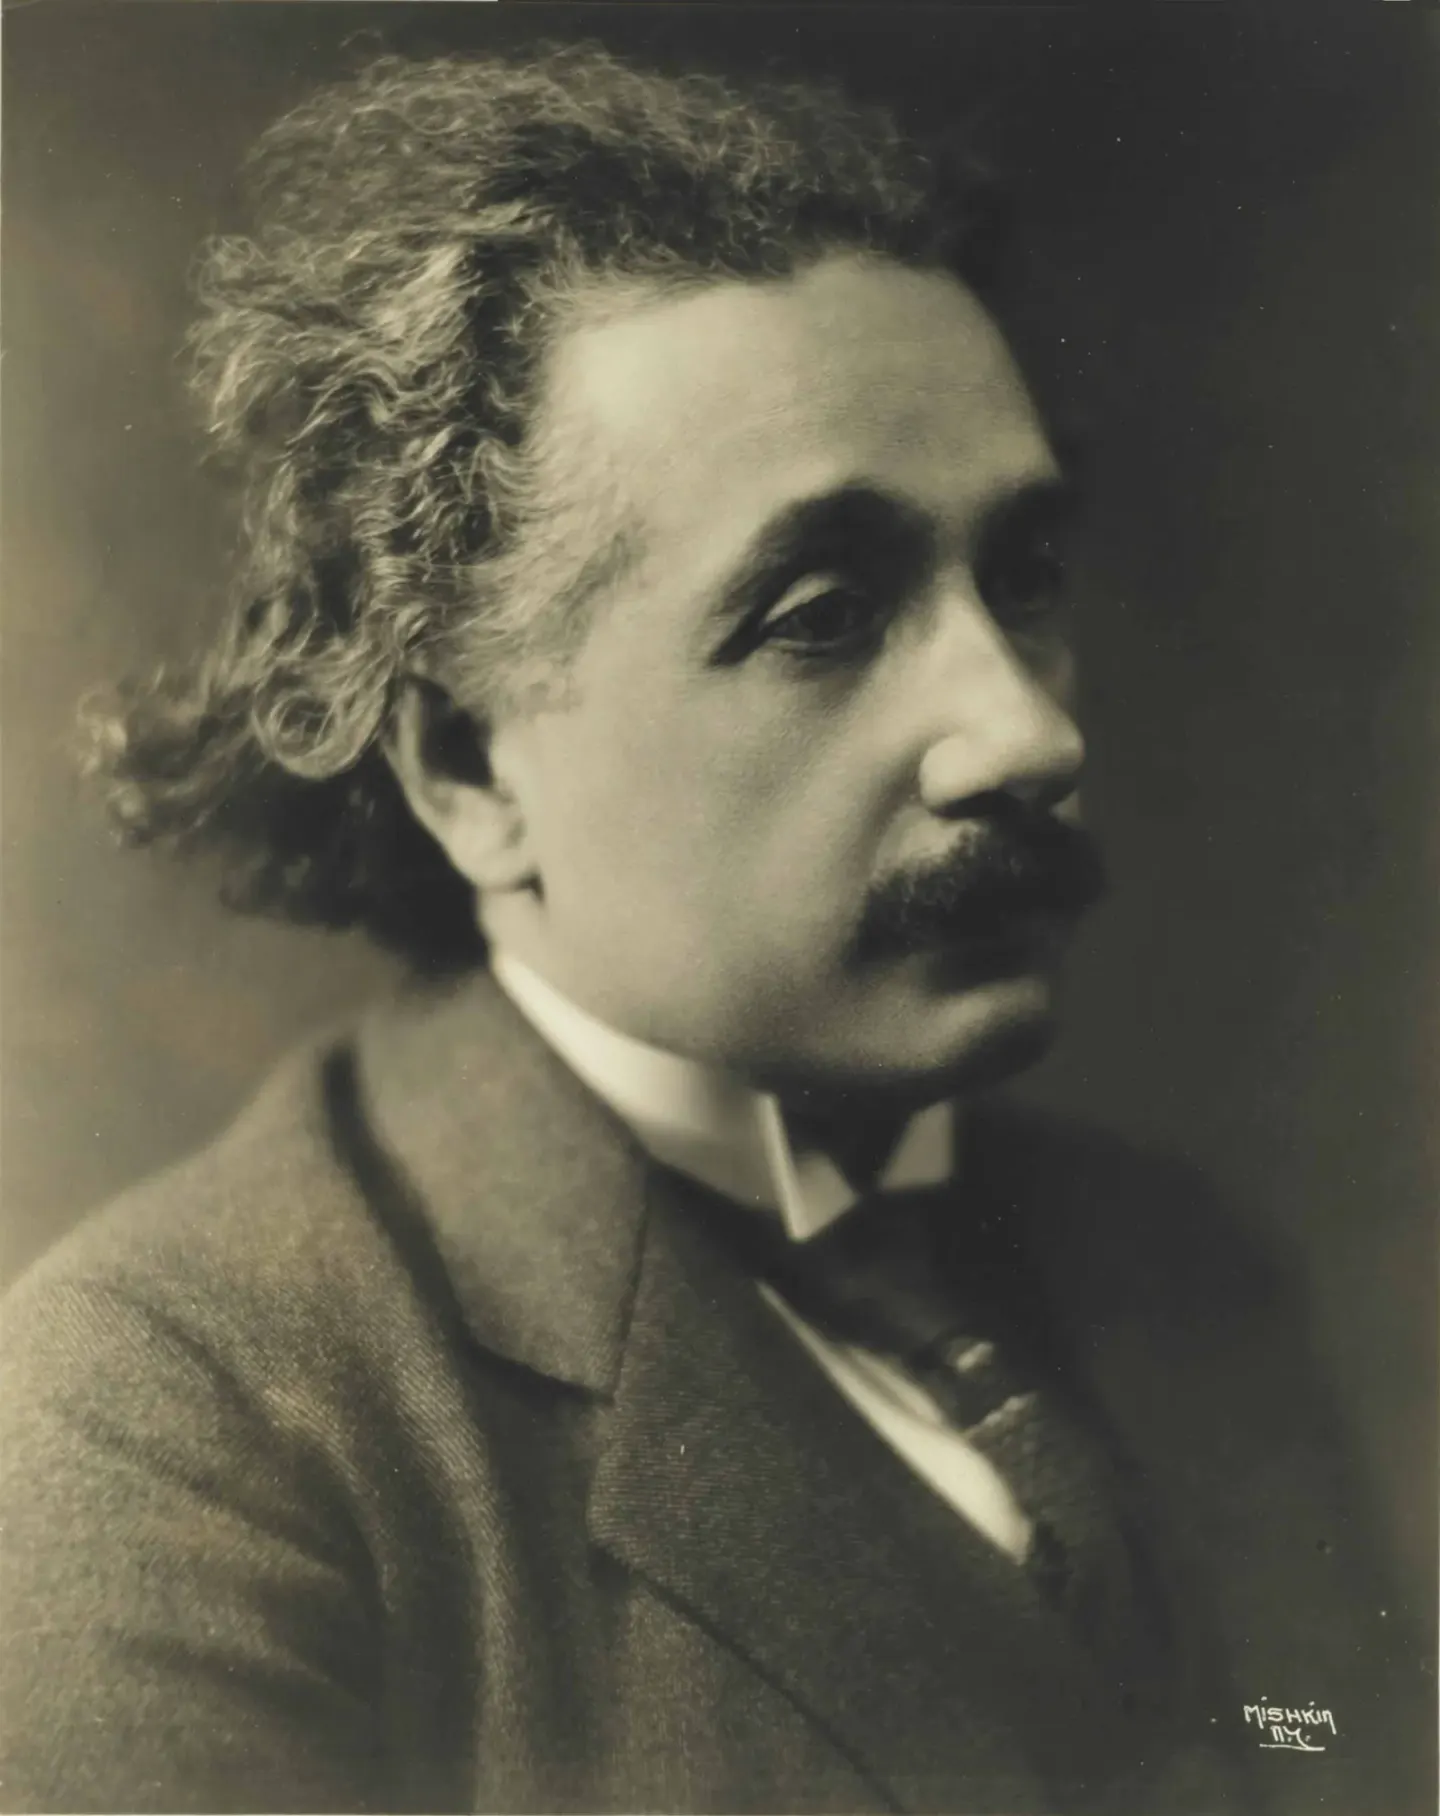
Albert Einstein, 1921 · photo by Herman Mishkin · Wikimedia Commons (public domain)
The stumbling block was gravity. Because gravity pulls everything toward everything else, a universe sitting still should collapse under its own weight. Einstein added a single term to his equations to prevent this collapse. The cosmological constant is a term that dwells evenly everywhere in space, producing a pushing effect that opposes the pull of gravity, which Einstein added to his equations in 1917. If the pull and the push match precisely, the universe can stay put.
This article follows the sequence in which the Big Bang, examined as a concept in "Galaxies and the Universe — Farmhouses on a Widening Field, Old Light Arriving from Every Side", came to be accepted. The Big Bang is a name that jointly points to the initial time when a very hot and dense universe began to expand, and the explanation that the universe has grown wider as it cooled ever since. At the end, we look at the three strands of cracks still remaining in that picture of the universe, along with how certain each one is. The 100-year story is, after all, a story of what we use to measure the universe—in short, a story of scales.
Galaxies Are Moving Away
The expanding universe emerged from mathematics before observation. In 1922 and 1924, Russian mathematician Alexander Friedmann found solutions to the same general relativity equations for a universe that grows or shrinks over time. In the Soviet Union, these solutions were long treated merely as mathematical outcomes unrelated to the real universe (arXiv:2511.06018).
In 1927, Belgian astronomer and Catholic priest Georges Lemaître independently reached nearly the same result and even derived the relationship that the speed at which galaxies move away is proportional to their distance. Lemaître published this paper in a Belgian academic journal that was not widely read, and the person who obtained the same relationship through observation was American astronomer Edwin Hubble (arXiv:2511.06018). The Hubble-Lemaître law is the relationship stating that the farther away a galaxy is, the faster it moves away in proportion to its distance. The fact that galaxies are moving away from each other in every direction meant that the entire universe is growing larger.
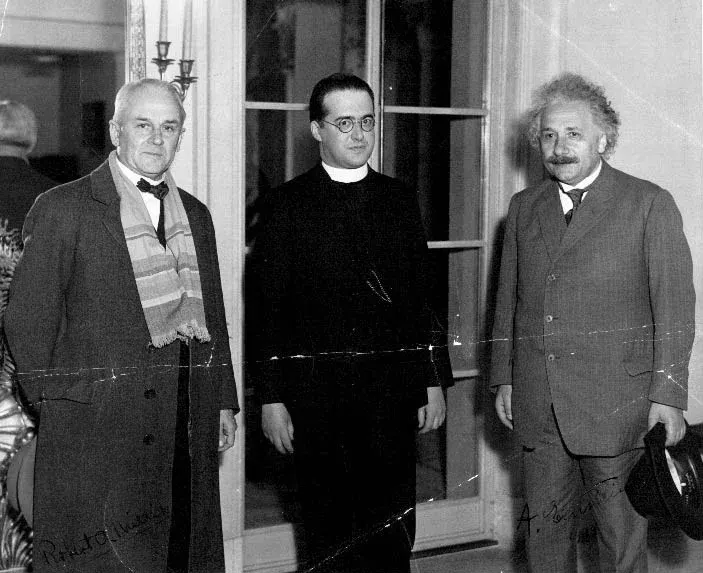
Robert Millikan, Georges Lemaître and Albert Einstein (from left), Caltech, January 1933 · photographer unknown · Wikimedia Commons (public domain)
The Hubble constant represents the magnitude of that proportionality—in other words, the speed at which the universe is currently expanding, written as how many kilometers per second faster galaxies move away for every 3.26 million light-years increase in distance. This unit is abbreviated as km/s/Mpc. For 100 years since it became known that galaxies are moving away from each other, astronomers have been devoted to measuring this number accurately (arXiv:2305.11950). The biggest dispute in the latter half of this article centers precisely on this number.
If you run the expansion backward, the universe becomes increasingly small and dense. In 1930, British astronomer Arthur Eddington showed that Einstein's static model was unstable and could not be realized in nature (arXiv:2511.06018). This means it is such a finely tuned balance that even the slightest deviation tips it toward expansion or contraction. The following year, in 1931, Lemaître put forward the hypothesis that the universe began from a hot, dense state he called the "primeval atom" (arXiv:2511.06018). In an expanding universe, the cosmological constant that had been added to preserve a static universe had no work left to do, and Einstein dropped this term not long afterward. The universe had now become a changing stage, and a changing stage could have a beginning.
Fossils Left Behind by a Hot Beginning
From the late 1940s, cosmology was split between two pictures. One picture was that the universe has expanded and cooled from a hot, dense beginning. The other was the steady-state theory, which held that the universe expands, but new matter keeps being created in the gaps so the average density always stays the same, meaning no beginning was needed. Because both pictures explained why galaxies are moving apart, the verdict came down to finding something that “should still remain if there had been a hot beginning”.
The hot universe model by Russian-born American physicist George Gamow pinned that down. In standard accounts of science history, American physicists Ralph Alpher and Robert Herman, who worked with Gamow, predicted in 1948 that the heat from the beginning should have cooled down and now blanket the whole sky as radiation of a few degrees absolute (Kelvin). A 2025 historical review bundles this prediction into a property of the “Lemaître-Gamow model” and notes that Lemaître also anticipated background radiation as a trace of that model in his book (arXiv:2511.06018). The cosmic microwave background is faint microwaves coming evenly from the whole sky now, formed when light freed when the universe first became transparent was stretched by expansion. In 1965, radio astronomers Arno Penzias and Robert Wilson at Bell Labs in the United States caught this noise coming with the same strength from every direction. The same historical paper also records the fact that Soviet researcher Tigran Shmaonov measured this radiation a few years earlier in 1956 and that his paper came out in 1957 (arXiv:2511.06018).
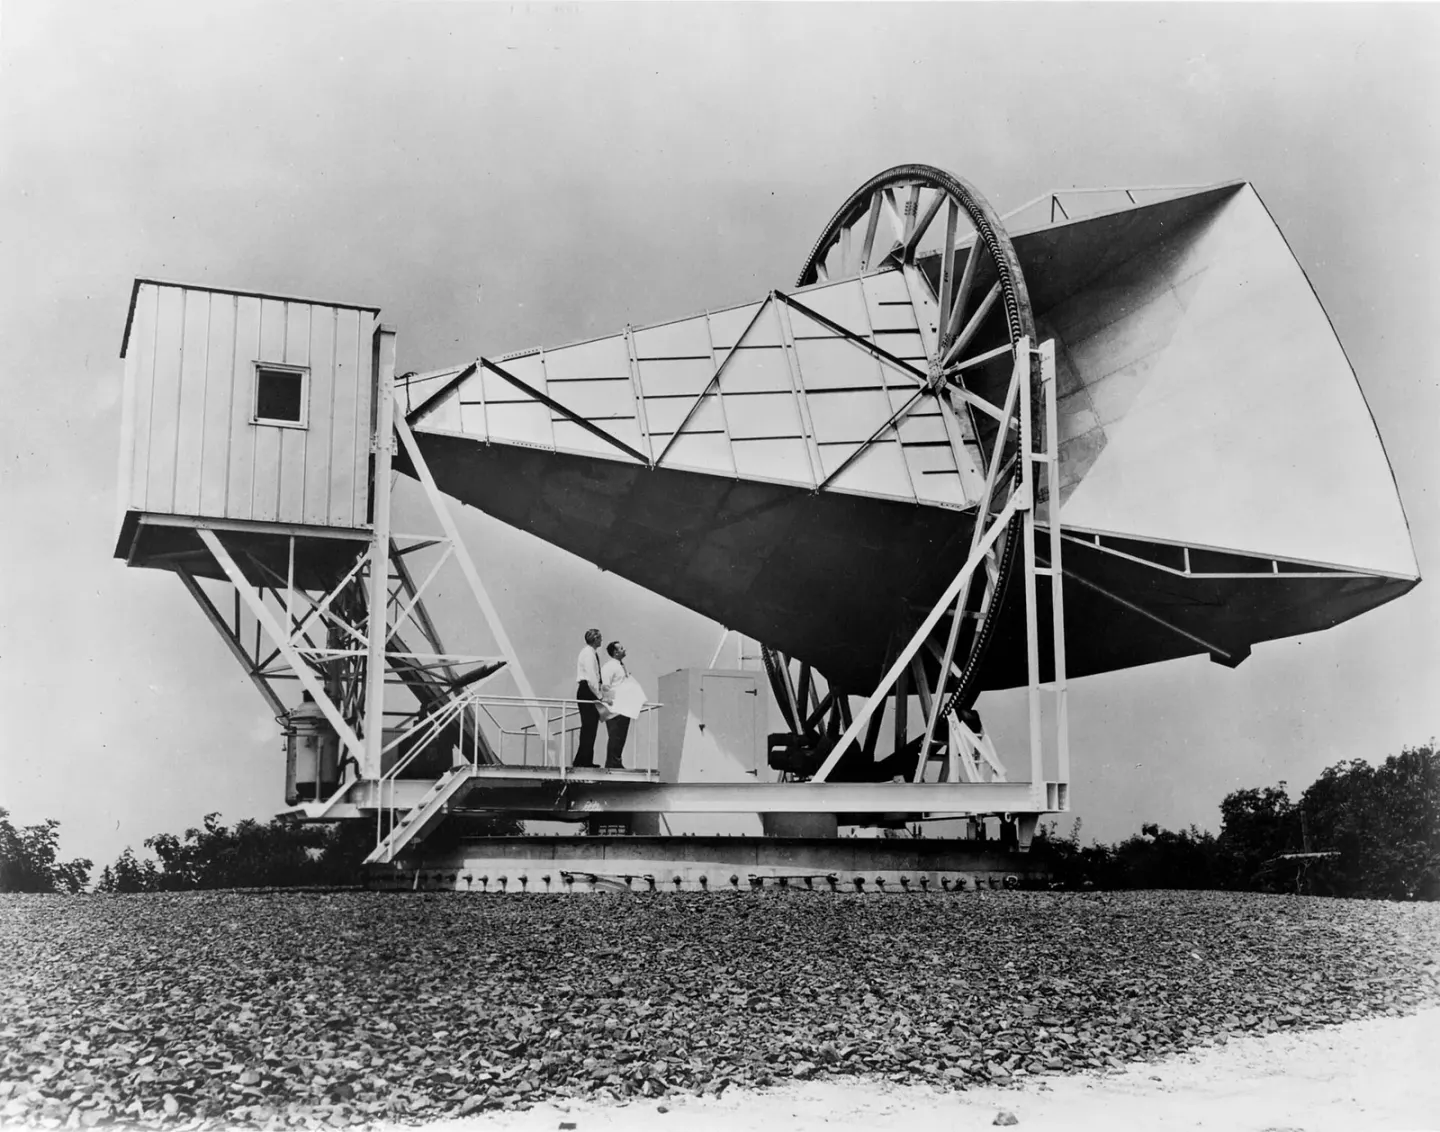
The horn antenna at Bell Labs, Holmdel, New Jersey (built 1959) · NASA, 1962 · Wikimedia Commons (public domain)
The shape of that light was measured precisely in the 1990s. Light emitted by a hot object has a shape determined by a single temperature, and in measurements by the COBE satellite, the degree to which the background radiation deviated from that shape was less than 50 parts in 1 million of the peak height. The temperature was 2.728 ± 0.004 Kelvin (95% confidence level), which is roughly minus 270 degrees Celsius (arXiv:astro-ph/9605054). If the entire early universe was evenly hot, exactly this kind of light remains.
The second fossil was light elements. During the roughly first 20 minutes of the hot, dense universe, light atomic nuclei such as deuterium, helium-3, helium-4, and lithium-7 were made, and their amounts depend on how much ordinary matter making up atoms is in the universe. The patches in the background radiation freed about 380,000 years later also depend on the amount of this same ordinary matter. The values calculated separately from the two periods matched each other strikingly well (arXiv:astro-ph/0307244). The 2018 analysis by the Planck satellite also records that predictions for the first 20 minutes match observations of helium and deuterium very well (DOI: 10.1051/0004-6361/201833910).
There is one exception. For lithium-7, the “lithium problem” where prediction and observation do not match remains, and a 2020 analysis records that as deuterium observations became more precise, this problem actually grew sharper (DOI: 10.1088/1475-7516/2020/03/010). As the two fossils that should remain if the hot beginning is right—the old light across the entire sky and the amounts of light elements—were actually discovered, the Big Bang won the debate. Small discrepancies like lithium remained afterward.
1998, an expansion that should have been slowing down was speeding up
After the Big Bang took hold, the remaining question was the future of the expansion. Because all matter in the universe pulls on one another, the expansion should have been slowing down gradually, and measuring how much it was slowing down was thought to reveal the future of the universe. Measuring that required knowing very long distances.
A standard candle is a celestial object whose true brightness is known in advance, and measuring how dim it looks yields its distance. Among supernovae, where stars explode all at once at the end of their lives, Type Ia—which are white dwarfs that receive matter from a companion star and explode—were used as that candle. How white dwarfs and supernovae form is covered in "The Life — A Star's Arms Holding Up Its Own Weight, the Floor It Falls To". This is because the relationship between the rate at which brightness fades and the brightness at peak allows the brightness of each one to be standardized (arXiv:astro-ph/9812133).
In 1998, two research teams published their results separately. The High-Z Supernova Search Team, with American astronomer Adam Riess as the first author, used 16 distant supernovae and 34 nearby supernovae. The distant supernovae were on average 10–15% farther away than would be expected in a universe with no cosmological constant and little matter (arXiv:astro-ph/9805201). Being farther away meant that the expansion had been speeding up over time.
Sigma ($\sigma$) is a scale that takes the width of random measurement fluctuations as a single unit and counts how many such units apart two values are. The larger the number of units, the harder it is to view the difference as a chance occurrence. When Riess's team did not assume the amount of matter separately, the conclusion that the expansion was speeding up was 2.8$\sigma$ and 3.9$\sigma$ according to two analysis methods, and if space was assumed to be flat, the conclusion that the cosmological constant was greater than zero rose to 7$\sigma$ and 9$\sigma$. The authors noted that even when checking sources of error such as dust and sample selection one by one, within the range examined at the time, none of them reconciled this result with a decelerating universe without a cosmological constant (arXiv:astro-ph/9805201).
The Supernova Cosmology Project, led by American physicist Saul Perlmutter, used 42 distant supernovae to report that, even accounting for confirmed errors, there was a 99% probability that the cosmological constant was not zero and was positive (arXiv:astro-ph/9812133). Dark energy is the name given to something that makes the expansion of the universe accelerate. By 2003, as the number of supernovae grew to about 200, calculations combined with galaxy distribution observations yielded roughly 28% for matter and about 72% for the cosmological constant share. The paper summarizing those results notes that the acceleration is probably due to a pushing dark energy like Einstein's cosmological constant (arXiv:astro-ph/0309739).
The cosmological constant that had been added to preserve a static universe and then discarded returned this time as the simplest candidate for the dark energy that accelerates the expansion. Perlmutter, Riess, and Brian Schmidt, an American-born Australian astronomer who led the High-Z team, were awarded the 2011 Nobel Prize in Physics.
The Universe Written in Six Numbers
In the 2000s, satellites mapping the patches of the background radiation turned the picture into numbers. One more invisible ingredient goes into that picture. Dark matter is matter that does not emit light and therefore cannot be seen, revealing itself only by its gravity altering the movements of surrounding stars, gas, and light. What the American WMAP satellite confirmed with its first-year data was that a model where space is flat and contains the cosmological constant and dark matter fits the data remarkably well, whereas a model containing only matter does not. "Cosmic concordance," where different observations converge on the same answer, also came to light back then (arXiv:astro-ph/0306381).
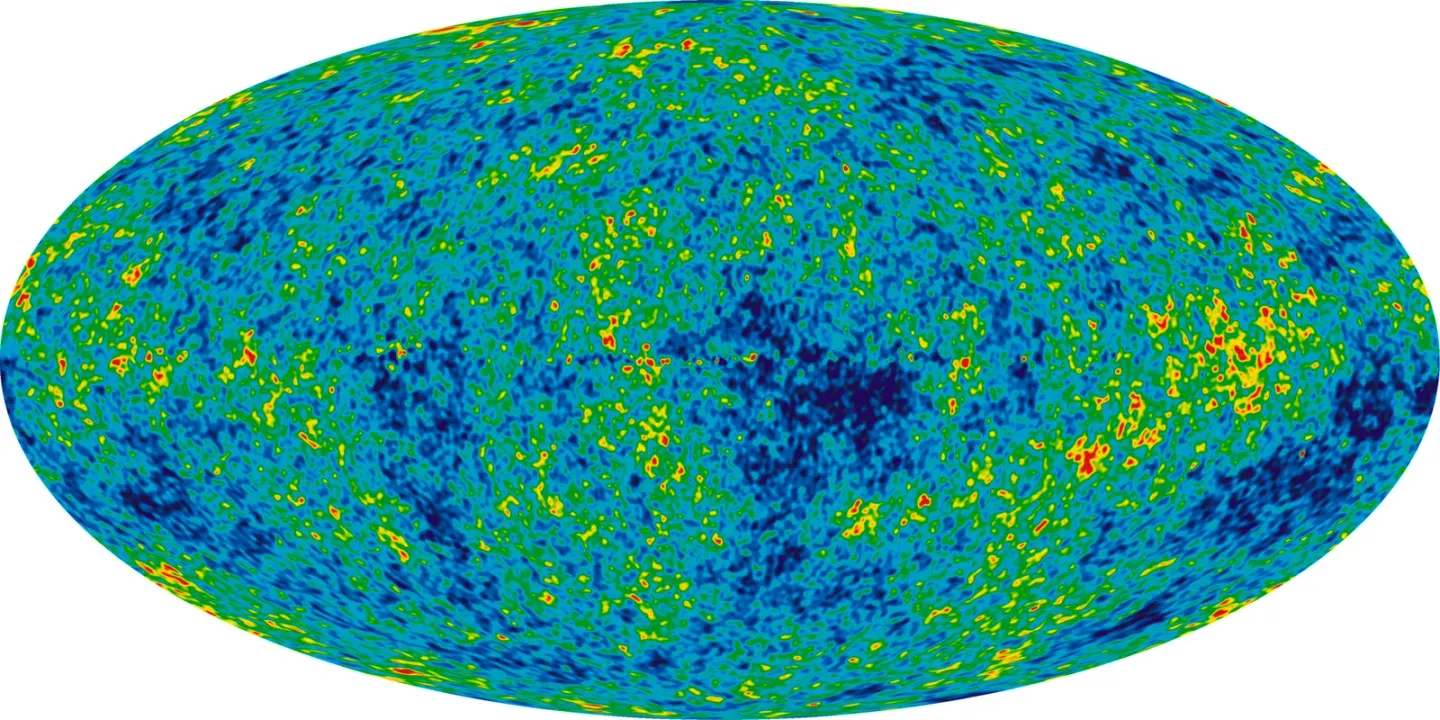
Cosmic microwave background temperature map from nine years of WMAP data · NASA/WMAP Science Team, 2012 · Wikimedia Commons (public domain)
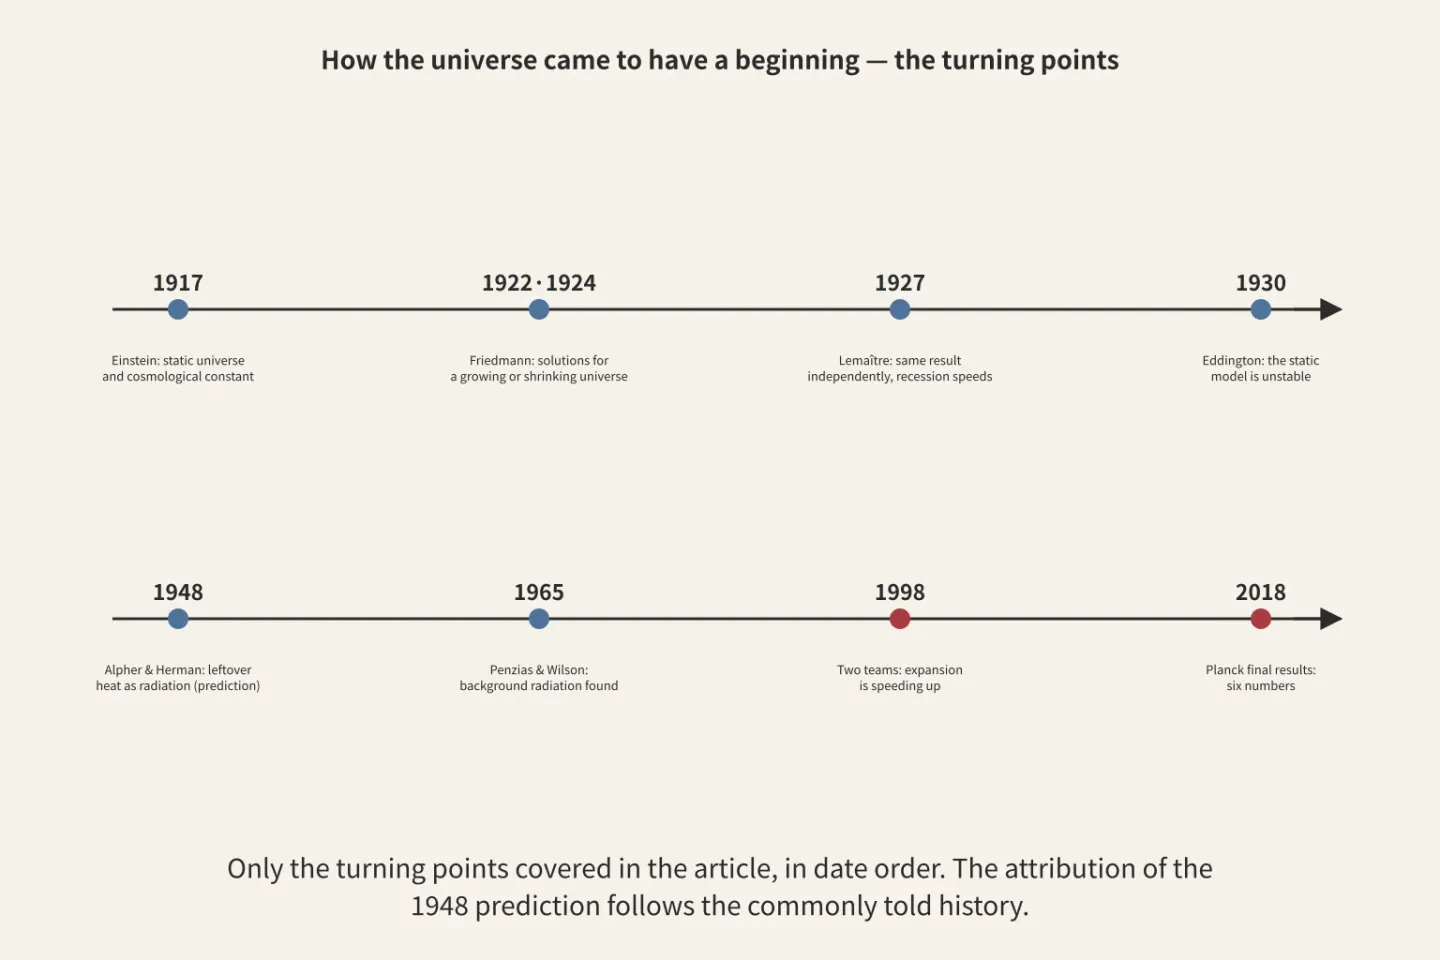
Figure: A diagram drawn by Paperis using only the text of the main body
The standard cosmological model is a model that views space as flat and the universe as filled with ordinary matter, dark matter, and the cosmological constant, describing the entire universe with six numbers. It is commonly called ΛCDM, combining the Greek letter lambda (Λ) with the abbreviation for cold dark matter. The WMAP observations alone narrowed the possible range for those six numbers by more than 68,000 times compared to before WMAP, and combined with other observations at times, they confirmed dark matter, the flatness of space, and accelerated expansion (arXiv:1404.5415).
Europe's Planck satellite tightened this model one more time in its 2018 final results. It measured the characteristic size of the background radiation patches on the sky with a precision of 0.03%, and the spatial curvature measured by combining galaxy distribution data was 0.001 ± 0.002, consistent with a flat universe. The Hubble constant calculated assuming the standard model was 67.4 ± 0.5 km/s/Mpc. The authors concluded that they found no compelling evidence that extensions beyond the standard model are necessary (DOI: 10.1051/0004-6361/201833910). As different observations—background radiation, light elements, supernovae, and galaxy distribution—converged on the same six numbers, the standard cosmological model became the standard of cosmology.
The end of the same abstract noted a single crack. Planck's result disagreed by 3.6σ with the Hubble constant measured directly in the nearby universe, and simple model extensions that would partially resolve this were not welcomed by the Planck data (DOI: 10.1051/0004-6361/201833910). Just a single 2014 analysis combined background radiation, galaxy distribution, and distance measurements to yield 69.6 ± 0.7 km/s/Mpc and concluded there was no compelling evidence for new physics (arXiv:1406.1718). That verdict began to wobble within a few years.
Two Different Expansion Speeds Pointed to by Two Rulers
Planck's 67.4 is a computed value. It is the expansion rate calculated today by measuring the size of the patches imprinted on the cosmic microwave background and assuming the standard model of the universe is correct (DOI: 10.1051/0004-6361/201833910). The other ruler measures distances to nearby galaxies one by one to obtain the same number directly. As seen in "Galaxies and the Universe — Farmhouses on a Widening Field, Old Light Arrival from Every Side", the Hubble tension is the problem where the expansion rate of the universe measured directly in the local universe and the value computed from traces of the early universe do not match each other.
Measuring directly is harder than it seems. Very nearby galaxies move randomly pulled by each other's gravity, making it difficult to isolate just the expansion, so we need to accurately know the distances to fairly distant galaxies. While stellar parallax can accurately measure distances to nearby stars within our Milky Way, there is no way to measure in a single method from nearby to far away (arXiv:2305.11950). The distance ladder is a distance measurement method that uses distances measured by reliable methods in the local area as a stepping stone, stringing together methods to measure farther regions rung by rung. Cepheid variables are stars whose brightness changes as they swell and shrink with a regular period, and the longer their period, the brighter their true brightness.
Let's climb the ladder rung by rung used by a research team called SH0ES. The leader of this team is Adam Riess, who was the first author of the accelerating expansion paper in 1998. On the first rung, distances are measured using geometry. The stepping stones are the parallaxes of Milky Way stars measured by the Gaia satellite, water vapor masers orbiting the black hole at the center of a galaxy named NGC 4258 (DOI: 10.3847/2041-8213/ab552d), and binary stars orbiting each other in the neighboring Large Magellanic Cloud. These distances calibrate the true brightness of Cepheid variables. On the second rung, all 42 usable Type Ia supernovae that have exploded in nearby galaxies over the past 40 years are selected, their distances are measured using Cepheids living in those galaxies, and the true brightness of the supernovae is calibrated. On the third rung, those calibrated supernovae are linked to a list of distant supernovae dominated by expansion, yielding the relationship between distance and recession speed (arXiv:2112.04510).
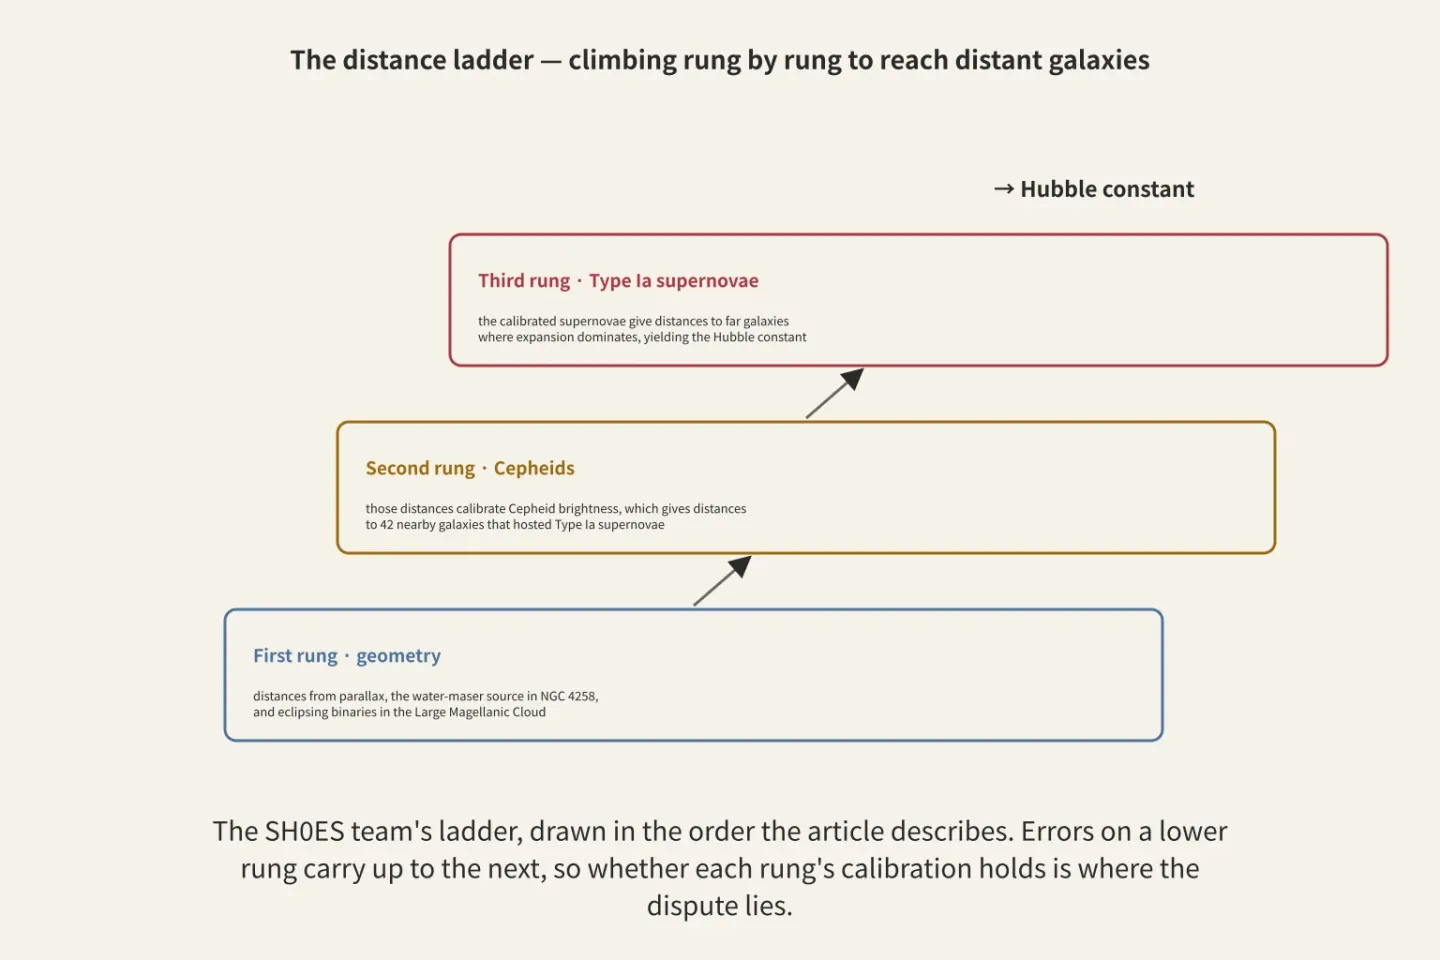
Figure: A diagram drawn by Paperis using only the text content
The value from the top was 73.04 ± 1.04 km/s/Mpc. Even when changing the analysis methods about 70 ways, this value stayed near the middle of them, and it was a 5σ difference from the value computed with Planck and the standard model. The authors concluded that they found no sign that this difference arose from measurement errors or analytical choices examined so far, and that the cause of this long-standing discrepancy remains unknown (arXiv:2112.04510).
The rung most often suspected was the second rung. Cepheids in distant galaxies are easily captured overlapping with neighboring starlight, and this overlap is the largest share among the fluctuations in Cepheid brightness relationships. The SH0ES team re-imaged over 1,000 Cepheids in NGC 4258 and five galaxies more clearly with the James Webb Space Telescope to check themselves, and found no meaningful difference from distances measured with the Hubble Space Telescope. The authors rejected the hypothesis at 8.2σ that the overlap error, which grows larger at greater distances, is the cause of the Hubble tension, and concluded that errors in Cepheid brightness measurements do not significantly contribute to the tension (DOI: 10.3847/2041-8213/ad1ddd). What this conclusion rejects is one branch of error called Cepheid brightness measurement.
Aside from Cepheids, there are standard candles. The tip of the red giant branch has a distinct upper limit in brightness, and that tip (TRGB) becomes another standard candle. According to textbook astrophysics explanations, this is because stars cannot get any brighter from the moment helium ignites in the center of a red giant. This method relies on simple physics called the core helium flash, and has the advantage that errors coming from dust, heavy elements, and crowding are small (DOI: 10.3847/1538-4357/ac0e95).
Distances measured by the two standard candles agreed with each other across multiple analyses. In the same paper, the SH0ES team wrote that TRGB distances measured with the Hubble Space Telescope are consistent with Cepheids, and combining the two gives 72.53 ± 0.99 km/s/Mpc (arXiv:2112.04510). A 2019 study that newly measured the distance to NGC 4258 noted that if both ladders are started and ended with the same calibration, there is no difference in the Hubble constant (DOI: 10.3847/2041-8213/ab552d).
There are also research teams yielding different central values with the same TRGB. The Chicago-Carnegie Hubble Program (CCHP), led by American astronomer Wendy Freedman, is a program that calibrates Cepheids and two types of old stars together. In 2019, this team's TRGB value was 69.8 ± 0.8 (statistical) ± 1.7 (systematic) km/s/Mpc, placing it right in the middle of the tension, differing from Planck by 1.2σ and from SH0ES by 1.7σ (DOI: 10.3847/1538-4357/ab2f73). The 2021 value of 69.8 ± 0.6 (statistical) ± 1.6 (systematic) had no statistically significant difference from the value computed from the cosmic microwave background, and agreed within 2σ with SH0ES's Cepheid calibration (DOI: 10.3847/1538-4357/ac0e95). The most precise value in the 2025 report was 70.39 ± 1.22 (statistical) ± 1.33 (systematic) ± 0.70 (supernova) km/s/Mpc obtained from a single TRGB. Using only James Webb data yielded 68.81 ± 1.79 (statistical) ± 1.32 (systematic) for TRGB, and 67.80 ± 2.17 (statistical) ± 1.64 (systematic) for another old star rich in carbon. Distances measured by the two old star methods agreed with each other within 1%, and differed by just over 1% from SH0ES's Cepheid distances. The authors concluded that this result is consistent with the standard model without new physics, and noted that further James Webb data will be needed in the future to make the local distance scale more precise and accurate (DOI: 10.3847/1538-4357/adce78).
A report published in 2026, which calls itself a "community consensus report", reached a conclusion on page 73. Experts from various distance measurement fields reviewed the data and voted on premier measurement methods before calculation, weaving them into a single net. The premier measurement methods agreed with each other within errors, and the Hubble constant in the local universe was 73.50 ± 0.81 km/s/Mpc. This value was 7.1σ away from 67.24 ± 0.35 computed with the early universe and standard model, and even if either Cepheids or TRGB were removed, the middle value hardly changed (DOI: 10.1051/0004-6361/202557993).
What diverges is the central values and interpretations among research teams rather than the measurement methods. CCHP produces values around 70, listing errors separately across three branches, and views them as consistent with the standard model, whereas SH0ES and the consensus report view TRGB as also matching Cepheids and the local universe's value as hovering around 73. How this dispute will end cannot be decided by the abstracts collected in this article alone.
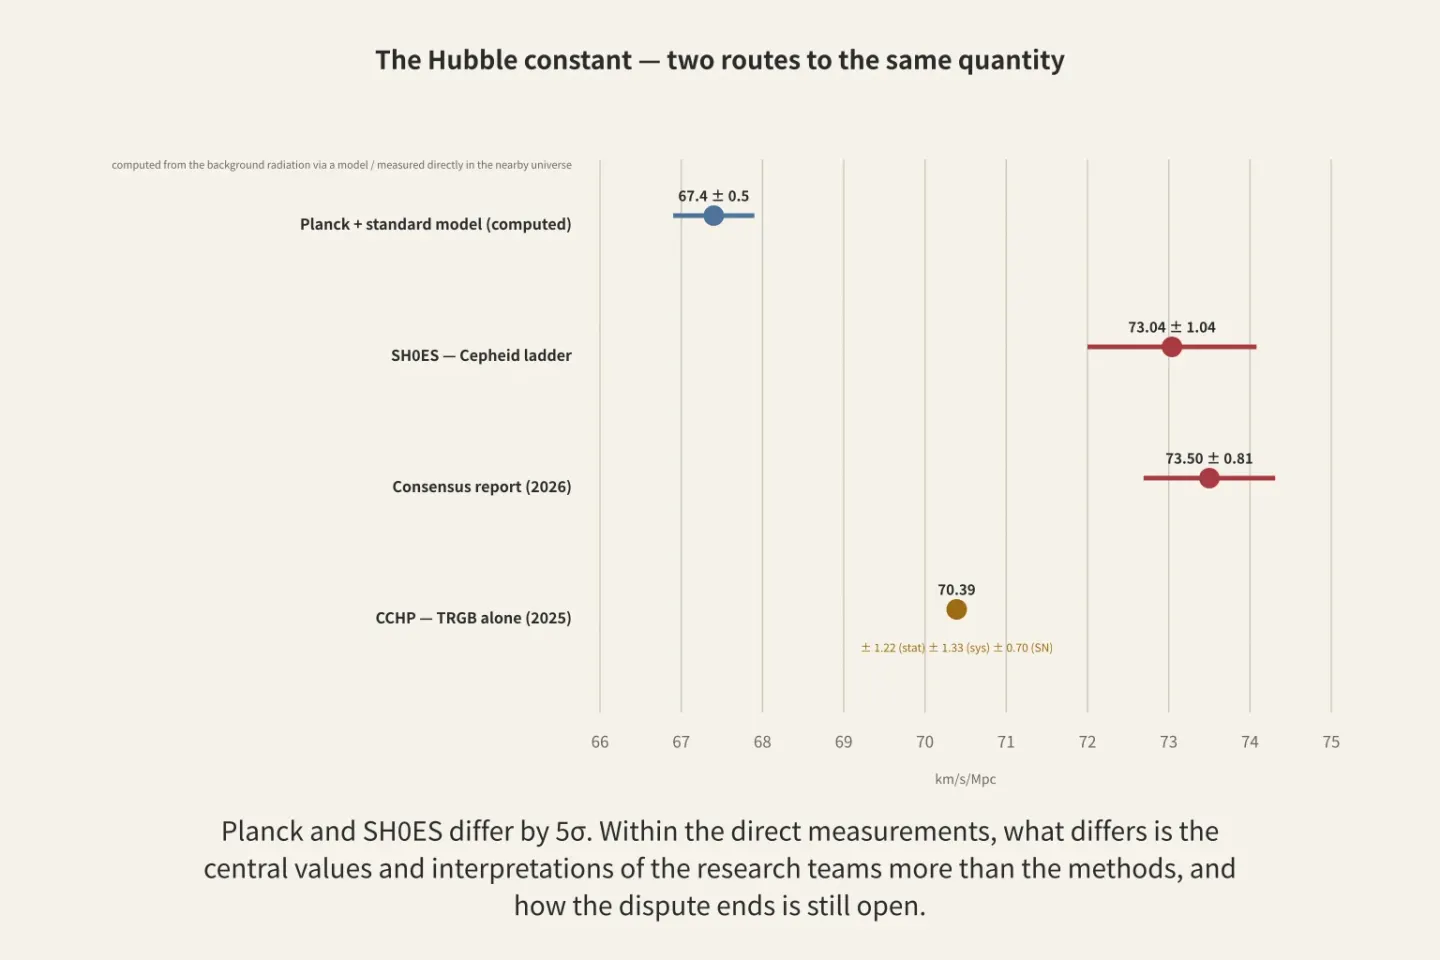
Figure: A diagram drawn by Paperis using only the text content
Where do methods that do not use the ladder at all place? A 2026 preprint gathered 58 measurements not using the ladder and obtained 69.37 ± 0.34, calculating it to be 6.5σ away from 72.73 ± 0.39 of 30 ladder measurements, and at least 3.9σ away even when accounting for overlapping data. The authors concluded that it is better to view this tension as "ladder versus everything else" rather than "early universe versus late universe." There was a 2.9σ discrepancy where analyses assuming the standard model yielded lower values even among measurements not using the ladder, and the authors noted that this suggests hidden errors in the ladder, a departure from the standard model, or both (arXiv:2601.00650). Another preprint, measured by observing that multiple images of distant celestial objects—warped into several images by the gravity of a heavy galaxy—show the same blinking at slightly different times, assumed a flat standard model and borrowed the amount of matter from supernova data to yield 71.1 km/s/Mpc (2.4 upward and 2.3 downward in error). Combining this value with other late universe measurements unrelated to the ladder, they reported a 2.7σ discrepancy from Planck even if the ladder is entirely excluded (DOI: 10.48550/arxiv.2610.14881).
The difference between the directly measured value of the local universe and the value computed by layering the standard model onto the cosmic microwave background has not decreased while measurements have become more precise, its cause is still unknown, and disputes among research teams remain over whether the center of the directly measured value is around 73 or 70. A 2026 preprint review evaluates that the Hubble tension has likely become a true crisis in modern cosmology. It summarizes that explanations fixing the early universe must fix both the beginning and late stages of the universe, while explanations fixing the late universe are strongly constrained by other observations (arXiv:2606.20434).
Early Galaxies Seen by James Webb
When the first data from the James Webb Space Telescope were released in the summer of 2022, the race to find the most distant galaxies began. The advantage of this telescope is infrared light. The light of distant galaxies is stretched by expansion along the way, pushing the part needed to gauge star mass toward infrared longer than 2.5 micrometers, and James Webb sees 1 to 5 micrometers (arXiv:2207.12446). James Webb takes pictures and also spreads out and reads light. Spectroscopy is the work of spreading light into a spectrum and examining how much light is contained at each wavelength. The principles of telescopes and spectroscopy are in "Light and Telescopes — A Letter That Arrives Late, a Fingerprint in the Envelope".
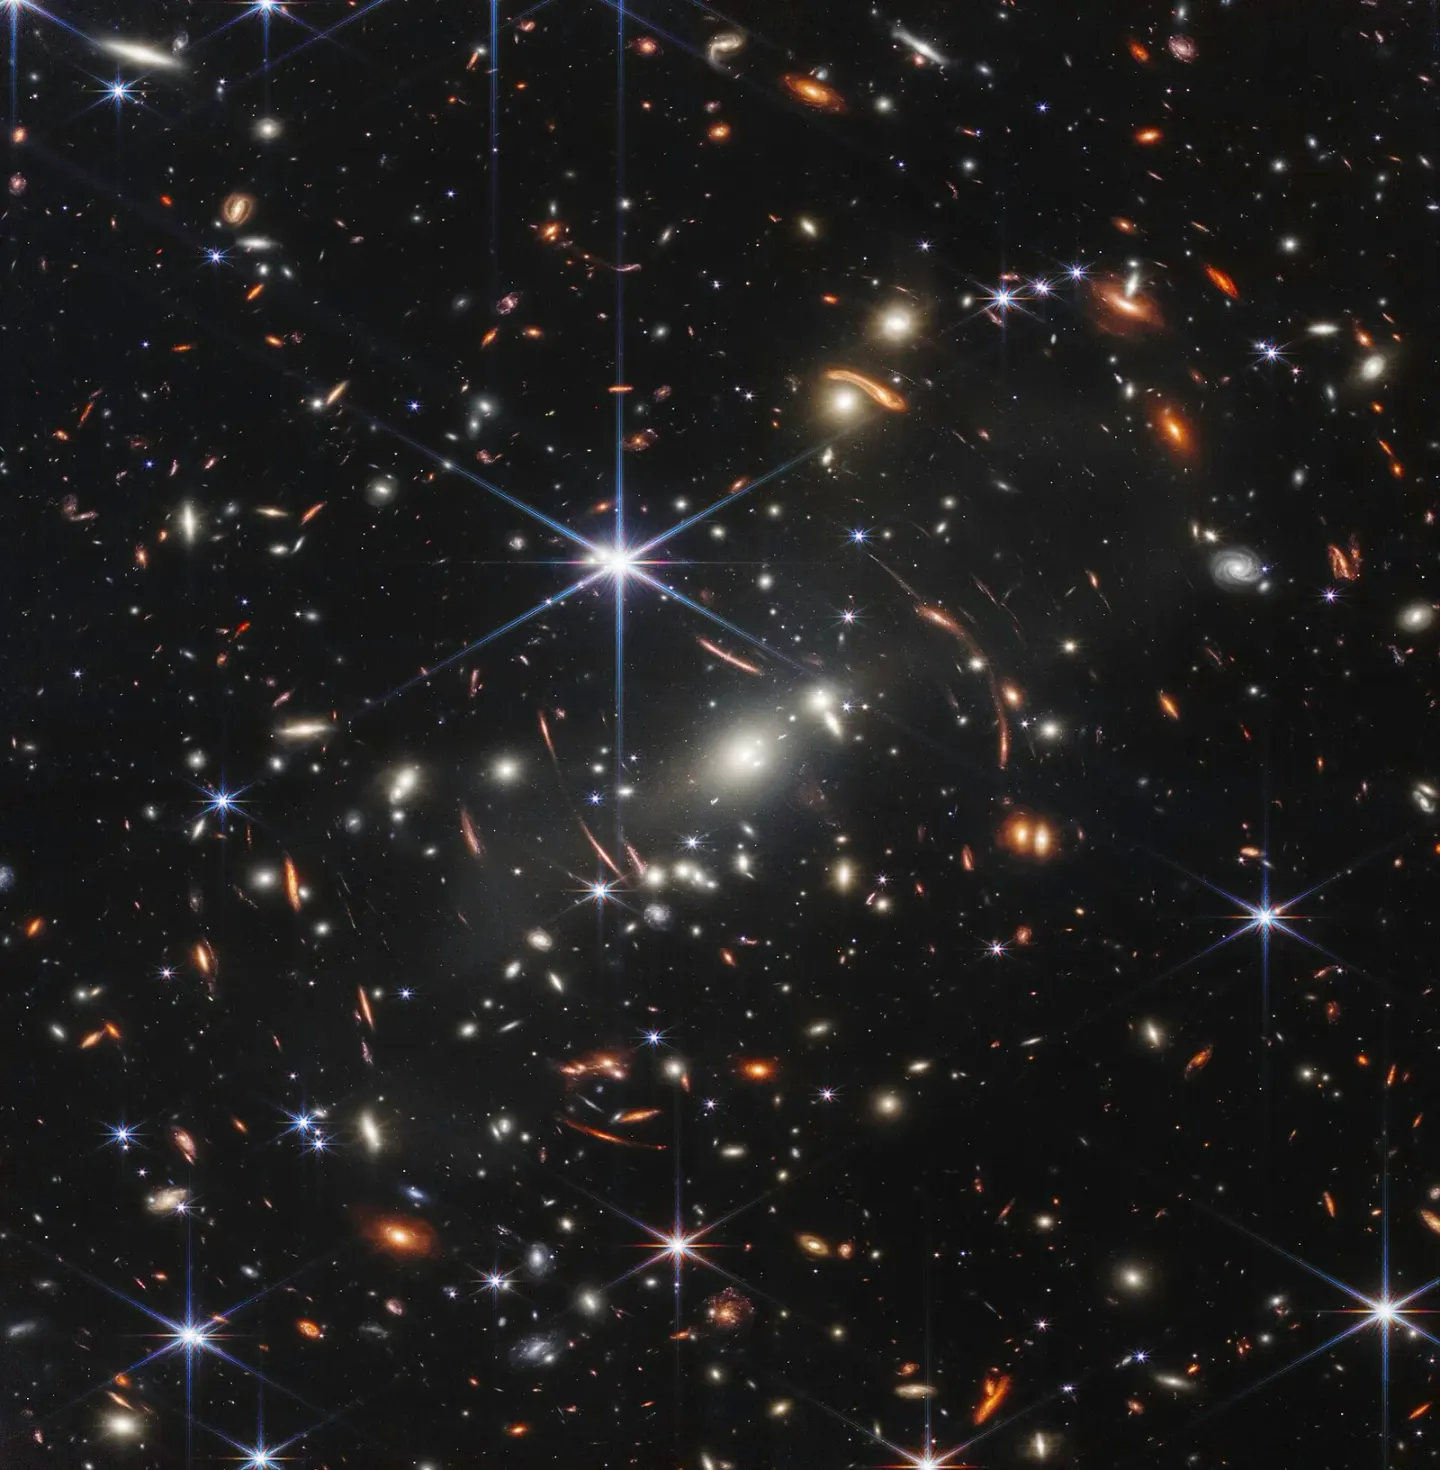
Webb's First Deep Field (galaxy cluster SMACS 0723), released 2022 · NASA, ESA, CSA, STScI · Wikimedia Commons (public domain)
Astronomer Ivo Labbé and other researchers picked six red galaxy candidates from that first data, from around 500 million to 700 million years after the big bang. These were candidates where the stellar mass exceeded 10 billion times that of the sun, and one might have been around 100 billion times. The authors wrote that if confirmed by spectroscopy, the amount of stars contained in heavy galaxies becomes much greater than expected by previous studies (arXiv:2207.12446). The weight of this sentence rests on "if confirmed".
Candidates and confirmations have different ranks. Candidates are distances and masses gauged simply by brightness taken through a few color filters, while spectroscopy directly reads the lines in the light to finalize the distance. British astronomer Emma Curtis-Lake and other researchers wrote that although dozens of galaxy candidates less than 450 million years after the big bang came out, none were confirmed by spectroscopy, leaving open the possibility that closer galaxies had actually mixed in. And they confirmed four such candidates through spectroscopy. These are galaxies chosen in a different way from an earlier period than Labbé's research team's candidates. The four galaxies had very few heavy elements, masses between 10 million and hundreds of millions of times that of the sun, and were young. The authors concluded that this shows first-generation galaxies appeared quickly (arXiv:2212.04568).
Spectroscopy also revealed the identity of other red celestial bodies. In a study examining 15 tiny, red celestial bodies in very distant places chosen from the beginning as candidates for galaxies where black holes shine, through spectroscopy, 60% were galaxies shining as the black hole at the center swallowed surrounding matter while hidden in dust, 20% were undecided, and 20% were brown dwarfs inside our galaxy, in other words, celestial bodies too light to become stars. These black hole galaxies are much more common than expected, and the authors wrote that this is a challenge to models where black holes grow (DOI: 10.3847/1538-4357/ad1e5f). These 15 are celestial bodies different from Labbé's research team's candidates, and an abstract stating whether Labbé's candidates themselves were confirmed or refuted by spectroscopy is not in the data of this article.
There is still a tension that remains. Large-scale simulations from 2022 roughly match observations for the number of galaxies up to around 450 million years after the big bang, but in the earliest interval, they predicted the number of bright galaxies and the speed at which stars form to be nearly 10 times fewer. The authors found the cause in that they still insufficiently understand new observation data, or the model of the process by which galaxies form needs to become more sophisticated, or perhaps it departed from the standard cosmological model, and at that time it was still before spectroscopic confirmation (DOI: 10.1093/mnras/stac3743).
Two papers from 2026 also still start from the fact that there are too many "unexpectedly heavy and bright galaxies", and the explanations branch into two directions. One study wrote that if one calculates more meticulously the process by which dark matter clumps cluster, one can reproduce the number of observed bright galaxies even within the standard model with appropriate star formation efficiency, suggesting that the cause of the excess lies in calculations that treated the process of clustering by gravity overly simply rather than new physics beyond the standard model (DOI: 10.3847/1538-4357/ae371b). Another simulation study reported that an early dark energy model originally proposed to solve the Hubble tension, in other words a model that slightly changes the expansion before the background radiation is set free, matches James Webb's galaxy count, and becomes the same as the standard model since the time when the universe was about a quarter of its current size. The authors claim that this model can solve the early galaxy problem and the Hubble tension together (DOI: 10.1093/mnras/stag1227).
What James Webb's early galaxies collide with is the model depicting how fast galaxies grew, and the explanations put forth by the papers gathered in this article all leave the hot beginning as it is while tweaking the details of galaxy formation or early expansion. These papers measure even the age of those galaxies with a clock of "several hundred million years after the big bang".
Is Dark Energy Changing?
The third crack came from yet another ruler. Baryon acoustic oscillations are the fixed intervals left behind when sound waves traveling through the hot matter of the early universe stopped, remaining as regular spacing in the current distribution of galaxies. If you place a ruler of known length at various distances and measure its apparent size, you can tell how fast the universe grew at different times. DESI (Dark Energy Spectroscopic Instrument) is an instrument that measures the distances to millions of galaxies spectroscopically to find these imprints.
The first-year DESI data used over 6 million distant celestial objects. Looking at this data alone, it matched the flat standard cosmological model. However, when combined with the cosmic background radiation, a model where dark energy changes over time instead of staying constant like the cosmological formula was favored at 2.6σ, and when supernova data were added, it was 2.5σ, 3.5σ, or 3.9σ depending on which supernova catalog was used (arXiv:2404.03002). In the 2025 results using three years of data and over 14 million galaxies and distant objects, this preference was 3.1σ when combined with the background radiation, and 2.8 to 4.2σ depending on the catalog when supernovae were added. Although DESI data alone were once again well-explained by the flat standard model, there was a mild 2.3σ tension with the values set by the background radiation. The authors concluded that, barring unknown systematic errors in one or more of the datasets, this combination challenges the standard cosmological model, and changing dark energy is a possible explanation (DOI: 10.1103/tr6y-kpc6).
In particle physics, a deviation exceeding 5σ is typically required to claim a "discovery." DESI's numbers fall below that threshold, and the bigger problem is that the numbers fluctuate significantly depending on the supernova catalog used. British cosmologist George Efstathiou pointed out that the evidence is about 3.9σ when combined with the 5-year supernova catalog from the Dark Energy Survey (DES), and about 2.5σ when combined with Pantheon+, a supernova catalog that aggregates multiple observations, and that the universe calculated using the Pantheon+ catalog alone matches Planck's standard model and does not favor changing dark energy. He found a discrepancy of about 0.04 magnitudes between nearby and distant supernovae included in both catalogs, and reported that a systematic error of this magnitude could eliminate the difference (DOI: 10.1093/mnras/staf301). The creators of the catalog countered that most of the discrepancy stemmed from differences in calibration methods between the two catalogs, and that even when substituting Pantheon+'s scatter model and host galaxy values, the evidence only decreased from 3.9σ to 3.3σ, making their results valid. However, they added that they found one underestimated error related to host galaxy properties, which could increase the error budget by 3% (DOI: 10.1093/mnras/staf943).
Other analyses point to the same spot. One analysis first showed that combining Planck and that very same contested 5-year supernova catalog with the Dark Energy Survey's galaxy distribution data instead of DESI yields evidence at the 3σ level, and then reported that the driving force behind changing dark energy comes from nearby supernovae shared by both supernova catalogs, and that accounting for that discrepancy substantially weakens the evidence (DOI: 10.1088/1475-7516/2025/04/048). A 2024 analysis recalculated using Planck's final data noted that when combined with the Pantheon+ catalog, the cosmological constant falls within 2σ, whereas when combined with the DES catalog, it is pushed beyond 2σ, concluding that the verdict that dark energy is changing is not yet robust (DOI: 10.3847/2041-8213/ad8c26). A 2026 preprint review summarizes that the question to ask now is no longer simply whether dark energy is changing, but how to distinguish between new physics and systematic errors (arXiv:2606.21826).
DESI's results are a sign that dark energy might be changing, and its strength ranges between 2.8σ and 4.2σ depending on the accompanying supernova data used. That verdict awaits more data and the outcome of the debate over systematic errors.
The Grades of the Three Cracks
When you place the three cracks side by side, their degrees of certainty differ from one another.
| Crack | What Disagrees with What | Size Stated in the Abstract | Current Grade |
|---|---|---|---|
| Hubble Tension | Value measured directly with the distance ladder versus value calculated by plugging the standard model into the background radiation | 73.04 ± 1.04 versus 67.4 ± 0.5 km/s/Mpc, 5σ / Consensus report 73.50 ± 0.81, 7.1σ / CCHP 70.39 ± 1.22 ± 1.33 ± 0.70 | The discrepancy is repeatedly confirmed by multiple methods. The cause is unknown. Researchers are arguing over the center of the directly measured values (around 73 versus 70) and their interpretation |
| Early Galaxies | Number of bright galaxies seen by James Webb versus galaxy formation models | Simulations predicted nearly 10 times fewer in the earliest intervals (2022, before spectroscopic confirmation) | Very early galaxies are confirmed by spectroscopy. Spectroscopic rulings on heavy galaxy candidates (RAVE) are not in the abstract of this paper. Many small, red objects separately chosen as AGN candidates are black hole galaxies or brown dwarfs. The overabundance is still the starting point in 2026, and explanations are under dispute |
| Changing Dark Energy | Calculation combining galaxy distribution, background radiation, and supernovae versus a constant cosmological constant | 3.1σ, up to 2.8~4.2σ including supernovae | A signal. Arguments over systematic errors in supernova data are ongoing |
The three cracks target the details of the standard cosmological model: the speed of expansion, the rate at which galaxies grew, and whether dark energy changes. Those calculations are based on a hot beginning. One value compared by the consensus report was 68.51 ± 0.58, calculated within a flat standard model using element synthesis in the first 20 minutes and the imprint of DESI (DOI: 10.1051/0004-6361/202557993), and the DESI first-year result for the Hubble constant of 68.52 ± 0.62 is also a value calculated under the constraints of the same element synthesis (arXiv:2404.03002).
It is also hard to see them as fully resolved. The lithium problem remains, the cause of the Hubble tension remains unknown as concluded by SH0ES, and whether dark energy changes will be decided only as more data accumulates. What is being argued now are the numbers describing the universe after the hot beginning, and it remains open whether those numbers will be reconciled or will force a change to a square of the standard model. A single term that Einstein put into his equations and took out in 1917 has been at the center of that dispute for over 100 years.
Source Papers
- "Nearly forgotten results in development of physical cosmology" (2025) — arXiv:2511.06018 — Einstein's 1917 static model and Eddington's proof of instability, Friedmann's 1922 and 1924 non-static solutions, Lémaître's 1927 derivation of Hubble's law and 1931 primeval atom, (argued in this review) predictions of a few-Kelvin background radiation by the Lémaître-Gamow model, Shmaonov's 1956 measurement (published 1957).
- "The Hubble Constant: A Historical Review" (2023) — arXiv:2305.11950 — Measurements of $H_0$ over the past 100 years, requiring large distances due to proper motion and using a distance ladder because no single method can measure the entire range, with ladder peak estimates at 73–75 versus background radiation predictions of 67.4.
- "The Cosmic Microwave Background Spectrum from the Full COBE/FIRAS Data Set" (1996) — arXiv:astro-ph/9605054 — Deviation from a blackbody is less than 50 ppm at the peak, temperature of $2.728 \pm 0.004\text{ K}$ (95%).
- "Big Bang Nucleosynthesis: Probing the First 20 Minutes" (2003) — arXiv:astro-ph/0307244 — D, $^3\text{He}$, $^4\text{He}$, and $^7\text{Li}$ in the first 20 minutes, sensitive to baryon density, presenting a picture strikingly consistent with the background radiation 380,000 years later.
- "Big-Bang Nucleosynthesis after Planck" (2020) — DOI: 10.1088/1475-7516/2020/03/010 — Planck fixes the baryon density at 0.9%, new Li/H data reaffirm the lithium problem, and D/H constraints make the problem sharper.
- "Observational Evidence from Supernovae for an Accelerating Universe and a Cosmological Constant" (1998) — arXiv:astro-ph/9805201 — 16 distant and 34 nearby Type Ia supernovae, 10–15% farther than expected, $q_0 < 0$ at $2.8\sigma$ and $3.9\sigma$, $\Omega_\Lambda > 0$ under a flatness assumption at $7\sigma$ and $9\sigma$, with no systematic error able to reconcile them with a decelerating universe.
- "Measurements of Omega and Lambda from 42 High-Redshift Supernovae" (1998) — arXiv:astro-ph/9812133 — Standardized using the light curve width-luminosity relation, $\Omega_M = 0.28$ assuming flatness, $P(\Lambda > 0) = 99%$ including confirmed systematic errors.
- "The Accelerating Universe and Dark Energy: Evidence from Type Ia Supernovae" (2003) — arXiv:astro-ph/0309739 — About 200 Type Ia supernovae, combined with large-scale structure yielding $\Omega_M = 0.28$ and $\Omega_\Lambda = 0.72$, with the cause likely a repulsive dark energy such as a cosmological constant.
- "The Wilkinson Microwave Anisotropy Probe" (2003) — arXiv:astro-ph/0306381 — Flat $\Lambda\text{CDM}$ fits remarkably well while Einstein-de Sitter does not, showing cosmic consistency.
- "Results from the Wilkinson Microwave Anisotropy Probe" (2014) — arXiv:1404.5415 — Reduced the 6-parameter volume by more than 68,000 times, confirming dark matter, flatness, and accelerated expansion.
- "Planck 2018 results: VI. Cosmological parameters" (2020) — DOI: 10.1051/0004-6361/201833910 — Acoustic angular size of 0.03%, assuming the standard model $H_0 = 67.4 \pm 0.5$ (model-dependent), $\Omega_K = 0.001 \pm 0.002$, no convincing evidence for expansion, consistent BBN helium and deuterium predictions, and a $3.6\sigma$ tension with the local $H_0$.
- "The 1% Concordance Hubble Constant" (2014) — arXiv:1406.1718 — Background radiation, BAO, and the ladder are statistically consistent, $H_0 = 69.6 \pm 0.7$, no convincing evidence for new physics.
- "A Comprehensive Measurement of the Local Value of the Hubble Constant with 1 km/s/Mpc Uncertainty from the Hubble Space Telescope and the SH0ES Team" (2021) — arXiv:2112.04510 — Cepheids in 42 Type Ia host galaxies, calibrated with Gaia parallaxes, NGC 4258 megamasers, and LMC eclipsing binaries, $H_0 = 73.04 \pm 1.04$, about 70 variants, $5\sigma$ tension with Planck + $\Lambda\text{CDM}$, cause unknown.
- "JWST Observations Reject Unrecognized Crowding of Cepheid Photometry as an Explanation for the Hubble Tension at 8σ Confidence" (2024) — DOI: 10.3847/2041-8213/ad1ddd — Over 1,000 Cepheids, distance modulus difference between HST and JWST of $-0.01 \pm 0.03\text{ mag}$, rejecting the crowding error hypothesis that grows with distance at $8.2\sigma$ confidence.
- "Measurements of the Hubble Constant: Tensions in Perspective" (2021) — DOI: 10.3847/1538-4357/ac0e95 — TRGB relies on the simple physics of the core helium flash, $H_0 = 69.8 \pm 0.6 \pm 1.6$, no significant difference from the background radiation value.
- "The Carnegie-Chicago Hubble Program. VIII. An Independent Determination of the Hubble Constant Based on the Tip of the Red Giant Branch" (2019) — DOI: 10.3847/1538-4357/ab2f73 — TRGB yields $H_0 = 69.8 \pm 0.8 \pm 1.7$, right in the middle of the tension, $1.2\sigma$ from Planck and $1.7\sigma$ from SH0ES.
- "Status Report on the Chicago-Carnegie Hubble Program (CCHP): Measurement of the Hubble Constant Using the Hubble and James Webb Space Telescopes" (2025) — DOI: 10.3847/1538-4357/adce78 — TRGB alone 70.39 $\pm 1.22 \pm 1.33 \pm 0.70$, JWST-only TRGB 68.81 and JAGB 67.80, distances differ by just over 1% from SH0ES, consistent with $\Lambda\text{CDM}$ without new physics, requiring future JWST data to improve precision and accuracy.
- "The Local Distance Network: A community consensus report on the measurement of the Hubble constant at ∼1% precision" (2026) — DOI: 10.1051/0004-6361/202557993 — Pre-calculation voting selects the premier measurement method, $H_0 = 73.50 \pm 0.81$, $7.1\sigma$ from early universe + $\Lambda\text{CDM}$ $67.24 \pm 0.35$, $5.0\sigma$ from DESI DR2 BBN + BAO $68.51 \pm 0.58$, with the central value remaining almost unchanged even when omitting Cepheids or TRGB.
- "Dissecting the Hubble tension: Insights from a diverse set of Sound Horizon-free H0 measurements" (2026, preprint) — arXiv:2601.00650 — 30 ladder measurements at $72.73 \pm 0.39$ versus the remaining 58 at $69.37 \pm 0.34$, $6.5\sigma$ (at least $3.9\sigma$ accounting for correlations), framed as "the ladder versus everything else."
- "TDCOSMO 2026: new insights on the Hubble tension from strong lensing time delays" (2026, preprint) — DOI: 10.48550/arxiv.2610.14881 — Time delays of 11 multiply imaged quasars yield $H_0 = 71.1(+2.4/-2.3)$, independent of the ladder, and $2.7\sigma$ from Planck even when excluding the ladder.
- "The Hubble tension: A decade review" (2026, preprint) — arXiv:2606.20434 — The tension has likely become a true crisis, early universe solutions must fix both the beginning and the end, and late universe solutions are strongly constrained.
- "A population of red candidate massive galaxies ~600 Myr after the Big Bang" (2022) — arXiv:2207.12446 — 6 candidate massive galaxies around 500,000,000 to 700,000,000 years after the Big Bang (exceeding $10^{10}$ solar masses, one at $\sim 10^{11}$), with spectroscopic confirmation implying a stellar mass density much higher than expected.
- "Spectroscopic confirmation of four metal-poor galaxies at z=10.3-13.2" (2022) — arXiv:2212.04568 — Dozens of $z > 10$ candidates lacked spectroscopic confirmation, risking low-redshift intruder status; four are spectroscopically confirmed as extremely metal-poor, $10^7$ to several $\times 10^8$ solar masses, and young, showing the rapid emergence of first-generation galaxies.
- "UNCOVER Spectroscopy Confirms the Surprising Ubiquity of Active Galactic Nuclei in Red Sources at z > 5" (2024) — DOI: 10.3847/1538-4357/ad1e5f — 60% of 15 small red candidates are dust-obscured active galactic nuclei, 20% are inconclusive, and 20% are brown dwarfs, with a surprisingly high number density that challenges black hole growth models (selected as AGN candidates from the start).
- "The MillenniumTNG project: the galaxy population at z ≥ 8" (2022) — DOI: 10.1093/mnras/stac3743 — Generally consistent with observations down to $z \sim 10$, predicting nearly an order of magnitude fewer bright galaxies at $z \gtrsim 12$, due to either data misunderstandings, galaxy formation models, or departures from $\Lambda\text{CDM}$, pending spectroscopic confirmation.
- "Matching JWST Ultraviolet Luminosity Functions with Refined ΛCDM Halo Models" (2026) — DOI: 10.3847/1538-4357/ae371b — Reproduces $z = 7\text{--}14$ UV luminosity functions using refined halo mass functions, suggesting that the excess is due to simplified collapse calculations rather than new physics (with moderate star formation efficiency).
- "The Cosmic Rush Hour: Rapid formation of bright, massive, disky, star-forming galaxies as signatures of early-universe physics" (2026) — DOI: 10.1093/mnras/stag1227 — Early dark energy simulations match JWST luminosity and mass functions and converge to $\Lambda\text{CDM}$ at $z \lesssim 3$, which is argued to also resolve the Hubble tension.
- "DESI 2024 VI: Cosmological Constraints from the Measurements of Baryon Acoustic Oscillations" (2024) — arXiv:2404.03002 — Over 6 million objects, BAO alone consistent with flat $\Lambda\text{CDM}$, $H_0 = 68.52 \pm 0.62$ with BBN priors, DESI + CMB at $2.6\sigma$, and $2.5\sigma$, $3.5\sigma$, and $3.9\sigma$ upon adding supernovae.
- "DESI DR2 results. II. Measurements of baryon acoustic oscillations and cosmological constraints" (2025) — DOI: 10.1103/tr6y-kpc6 — Over 14 million objects, $2.3\sigma$ tension with CMB, dynamical dark energy DESI + CMB at $3.1\sigma$, $2.8\text{--}4.2\sigma$ including supernovae, indicating $\Lambda\text{CDM}$ is being challenged barring unknown systematic errors.
- "Evolving dark energy or supernovae systematics?" (2025) — DOI: 10.1093/mnras/staf301 — Evidence ranges from $\sim 3.9\sigma$ to $\sim 2.5\sigma$ depending on the supernova sample, Pantheon+ alone is consistent with Planck $\Lambda\text{CDM}$, with a $\sim 0.04\text{ magnitude}$ offset in common supernovae.
- "Comparing the DES-SN5YR and Pantheon+ SN cosmology analyses: investigation based on 'evolving dark energy or supernovae systematics'?" (2025) — DOI: 10.1093/mnras/staf943 — The discrepancy is mostly due to differences in Malmquist bias corrections, dropping from $3.9\sigma$ to $3.3\sigma$ even when changing the correction, supporting the DES-SN5YR results.
- "BAO vs. SN evidence for evolving dark energy" (2025) — DOI: 10.1088/1475-7516/2025/04/048 — The preference comes from low-redshift supernovae common to both catalogs, and the evidence weakens significantly when marginalizing over the discrepancy.
- "Updated Cosmological Constraints in Extended Parameter Space with Planck PR4, DESI Baryon Acoustic Oscillations, and Supernovae" (2024) — DOI: 10.3847/2041-8213/ad8c26 — CMB + BAO + Pantheon+ includes the cosmological constant within $2\sigma$, DESY5 excludes it at over $2\sigma$, dynamical dark energy is not yet robust, and the Hubble tension persists at $3.2\text{--}3.9\sigma$.
- "Dark Energy in the DESI Era: A Brief Review of Evidence, Beyond-ΛCDM Interpretations, and Tensions" (2026, preprint) — arXiv:2606.21826 — The strength of the preference depends on parameterization and data combinations, with the question being how to distinguish new physics from systematic errors.
Sources (34)
- Nearly forgotten results in development of physical cosmologyarXiv:2511.06018
- The Hubble Constant: A Historical ReviewarXiv:2305.11950
- The Cosmic Microwave Background Spectrum from the Full COBE/FIRAS Data SetarXiv:astro-ph/9605054
- Big Bang Nucleosynthesis: Probing the First 20 MinutesarXiv:astro-ph/0307244
- Big-Bang Nucleosynthesis after PlanckDOI 10.1088/1475-7516/2020/03/010
- Observational Evidence from Supernovae for an Accelerating Universe and a Cosmological ConstantarXiv:astro-ph/9805201
- Measurements of Omega and Lambda from 42 High-Redshift SupernovaearXiv:astro-ph/9812133
- The Accelerating Universe and Dark Energy: Evidence from Type Ia SupernovaearXiv:astro-ph/0309739
- The Wilkinson Microwave Anisotropy ProbearXiv:astro-ph/0306381
- Results from the Wilkinson Microwave Anisotropy ProbearXiv:1404.5415
- Planck 2018 results: VI. Cosmological parametersDOI 10.1051/0004-6361/201833910
- The 1% Concordance Hubble ConstantarXiv:1406.1718
- A Comprehensive Measurement of the Local Value of the Hubble Constant with 1 km/s/Mpc Uncertainty from the Hubble Space Telescope and the SH0ES TeamarXiv:2112.04510
- JWST Observations Reject Unrecognized Crowding of Cepheid Photometry as an Explanation for the Hubble Tension at 8σ ConfidenceDOI 10.3847/2041-8213/ad1ddd
- Measurements of the Hubble Constant: Tensions in PerspectiveDOI 10.3847/1538-4357/ac0e95
- The Carnegie-Chicago Hubble Program. VIII. An Independent Determination of the Hubble Constant Based on the Tip of the Red Giant BranchDOI 10.3847/1538-4357/ab2f73
- Status Report on the Chicago-Carnegie Hubble Program (CCHP): Measurement of the Hubble Constant Using the Hubble and James Webb Space TelescopesDOI 10.3847/1538-4357/adce78
- The Local Distance Network: A community consensus report on the measurement of the Hubble constant at ∼1% precisionDOI 10.1051/0004-6361/202557993
- Dissecting the Hubble tension: Insights from a diverse set of Sound Horizon-free H0 measurementsarXiv:2601.00650
- TDCOSMO 2026: new insights on the Hubble tension from strong lensing time delaysDOI 10.48550/arxiv.2610.14881
- The Hubble tension: A decade reviewarXiv:2606.20434
- A population of red candidate massive galaxies ~600 Myr after the Big BangarXiv:2207.12446
- Spectroscopic confirmation of four metal-poor galaxies at z=10.3-13.2arXiv:2212.04568
- UNCOVER Spectroscopy Confirms the Surprising Ubiquity of Active Galactic Nuclei in Red Sources at z > 5DOI 10.3847/1538-4357/ad1e5f
- The MillenniumTNG project: the galaxy population at z ≥ 8DOI 10.1093/mnras/stac3743
- Matching JWST Ultraviolet Luminosity Functions with Refined ΛCDM Halo ModelsDOI 10.3847/1538-4357/ae371b
- The Cosmic Rush Hour: Rapid formation of bright, massive, disky, star-forming galaxies as signatures of early-universe physicsDOI 10.1093/mnras/stag1227
- DESI 2024 VI: Cosmological Constraints from the Measurements of Baryon Acoustic OscillationsarXiv:2404.03002
- DESI DR2 results. II. Measurements of baryon acoustic oscillations and cosmological constraintsDOI 10.1103/tr6y-kpc6
- Evolving dark energy or supernovae systematics?DOI 10.1093/mnras/staf301
- Comparing the DES-SN5YR and Pantheon+ SN cosmology analyses: investigation based on 'evolving dark energy or supernovae systematics'?DOI 10.1093/mnras/staf943
- BAO vs. SN evidence for evolving dark energyDOI 10.1088/1475-7516/2025/04/048
- Updated Cosmological Constraints in Extended Parameter Space with Planck PR4, DESI Baryon Acoustic Oscillations, and SupernovaeDOI 10.3847/2041-8213/ad8c26
- Dark Energy in the DESI Era: A Brief Review of Evidence, Beyond-ΛCDM Interpretations, and TensionsarXiv:2606.21826