
Paperis Articles
GDP and the Business Cycle — The Last Receipt, and the Day No Receipt Records
What grew, compared with what, in a headline like 'growth was 0.6%'? How a country's output is measured, and what that number leaves out.
Your field's papers, as audio
Pick your fields and journals — Paperis summarizes the key papers and turns them into audio. Listen on your commute.
Start Paperis free →GDP and the Business Cycle — The Last Receipt, and the Day No Receipt Records
The Sentence "0.6% Growth"
Morning economic news often delivers sentences like this. For example, "The growth rate for the first quarter of this year was tallied at 0.6%." It is a familiar sentence, but if you are asked what actually grew by 0.6% compared to what, a clear answer does not come easily.
This article covers how to read that sentence. The examples are taken from Korean news, but the concepts apply in any country. The institution that compiles and announces GDP in Korea is the Bank of Korea.
We use a single receipt as a guide. If you collect and add up only the "final receipts" of things newly made within the country over a year, that sum is close to GDP, the protagonist of this article. Actual statistics do not collect receipts but rather estimate them from various data sources, but a receipt is convenient for following what is counted and what is left out.
Only the Final Receipt Counts
Gross Domestic Product (GDP) is the sum of the value of all final goods and services produced within a country over the course of a year. When people talk about quarterly GDP, you can just swap "a year" for "a quarter" (OpenStax Principles Macroeconomics 3e 6.1).
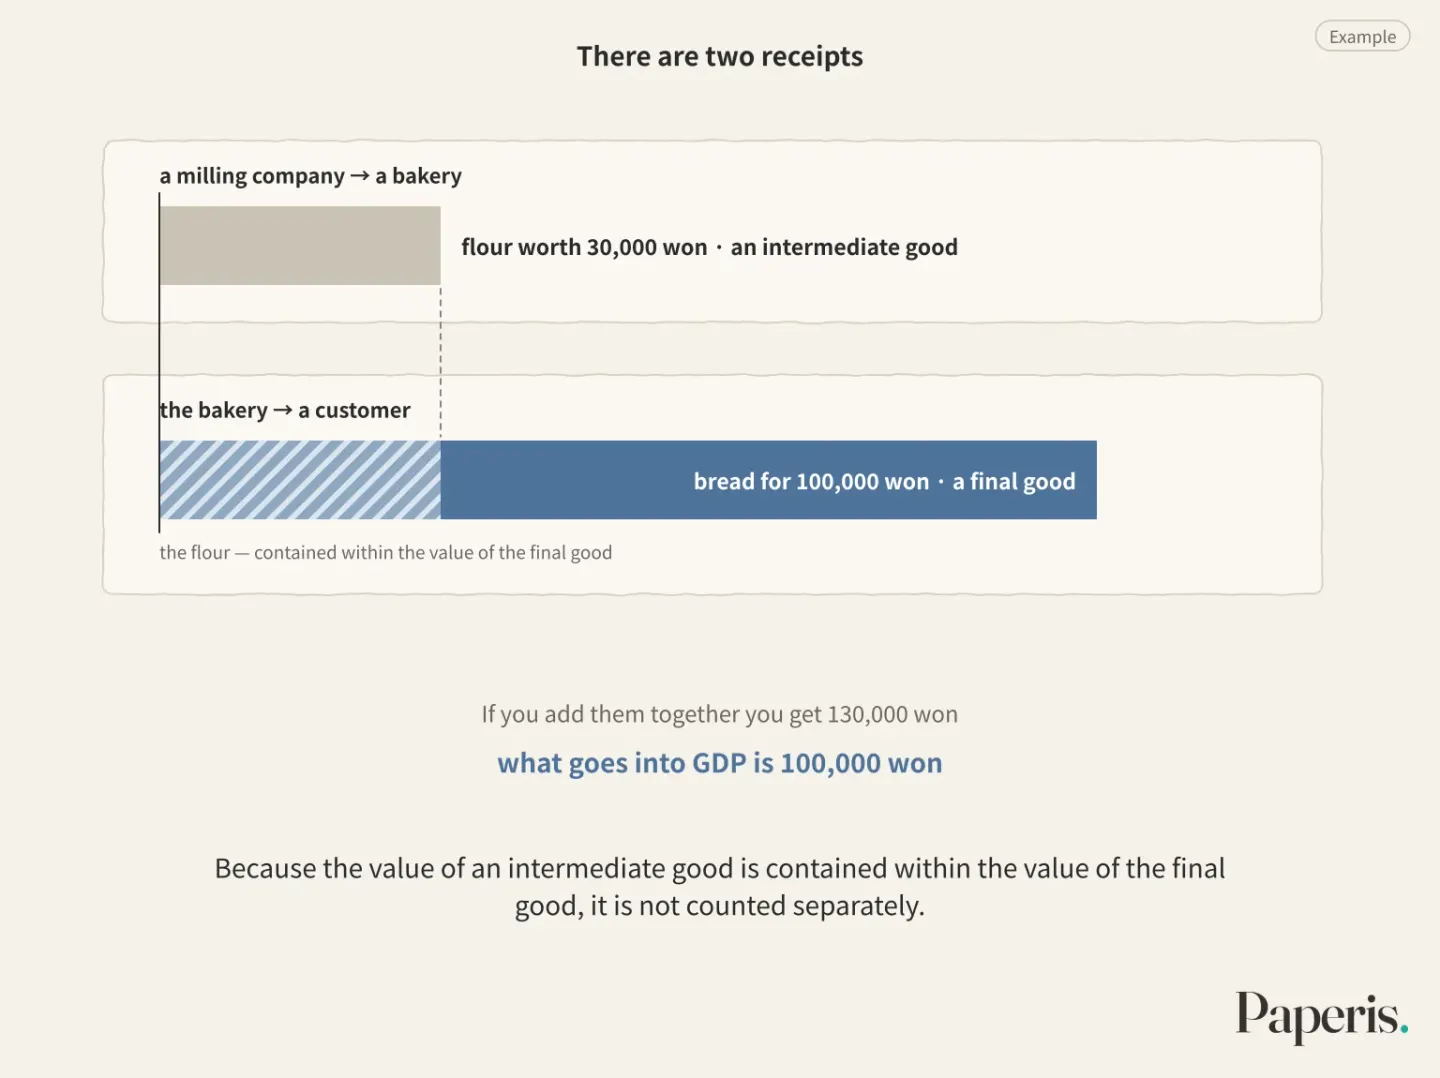
Let's follow along to a neighborhood bakery. For example, say a milling company sells flour worth 30,000 won to a bakery, and the bakery bakes bread with that flour and sells it to a customer for 100,000 won. There are two receipts. If you add them together you get 130,000 won, but what goes into GDP is 100,000 won.
The 100,000 won paid by the customer already melts in the 30,000 won cost of the flour. If you even add the flour receipt, the same flour gets counted twice. That is why GDP only counts the price of the bread that passed to the customer at the bakery counter (OpenStax Principles Macroeconomics 3e 6).
A final good is a good or service that does not go back in as an ingredient for another item and reaches its final use. The bread bought by the customer is a final good. An intermediate good is a good or service that goes in as an ingredient to make another item. The flour bought by the bakery is an intermediate good. Because the value of an intermediate good is contained within the value of the final good, it is not counted separately (OpenStax Principles Macroeconomics 3e 6.1).
There are things that do not get caught in GDP even though money changes hands. A bicycle bought on a secondhand trading app is an item made several years ago, and its value was already counted in the year it was made. Subsidy funds distributed by the government to households are left out because they are not the value of someone making something new. Conversely, there are things left out because money does not change hands. Laundry you run yourself at home is something nobody bought or sold (OpenStax Principles Macroeconomics 3e 6.1).
The word "domestic" also has a meaning. GDP counts things made within that country's borders. Goods made by a Korean company at a foreign factory go into the GDP of the country where that factory is located (OpenStax Principles Macroeconomics 3e 6.1).
GDP is the sum of only the final values of things newly made over the course of a year.
Who Bought It?
We can also divide the same pile of receipts by "who bought it." There are four main buyers: household consumption, business investment, government purchases, and transactions with foreign countries. Adding these four together gives us GDP again (OpenStax Principles Macroeconomics 3e 6.1).
Consumption is the money households spend on eating, wearing, and using everyday goods. Investment in the context of GDP refers to a business spending money to buy new things for production, like factories, buildings, and machinery. Since this means buying tangible equipment, it is different from "stock investing" in the news. The share of investment in the pile of receipts is smaller than the share of consumption, but its size fluctuates much more wildly from year to year than consumption does (OpenStax Principles Macroeconomics 3e 6.1). If businesses feel uneasy about the future, receipts for new machinery are often the first thing to shrink. That is why investment is a branch to watch closely when reading the economy.
Government spending is the money the government uses to buy goods and services like fire trucks and public libraries. Spending that merely transfers money, such as the subsidies we saw earlier, is not included (OpenStax Principles Macroeconomics 3e 6.1).
Net exports are exports minus imports. Things sold abroad were made in this country, so they are added, while imported goods bought by people in this country were made elsewhere, so they are subtracted. We subtract imports not because they are bad, but to count only what was made in this country. If exports and imports are equal, net exports are zero, and there is no effect on the size of GDP (OpenStax Principles Macroeconomics 3e 6.1). Exports and the trade balance are covered in detail in "Exchange Rates and Trade — A Seesaw Where One End Rises as the Other Sinks, and the People Riding Each End".
Did Prices Go Up, or Did We Make More?
Let's go back to the bakery. Suppose this year it sold 100 loaves of bread at 1,000 won each for a total of 100,000 won, and that next year it sells the exact same 100 loaves but raises the price to 1,100 won. The total on the receipt is 110,000 won, an increase of 10%. Yet the bakery did not make a single extra loaf of bread.
Nominal GDP is GDP measured using the actual prices set that year, without subtracting price changes. Just looking at the nominal figures, the bakery's business grew by 10%. The real value is the value measured after subtracting the portion by which prices rose. In real terms, the bakery's business stayed the exact same.
If you do not know how much prices have gone up, it is hard to tell whether an increase in GDP is mostly because prices went up or because more things were made. That is why the real value is usually more important (OpenStax Principles Macroeconomics 3e 6.2). To put it in terms of a receipt, the nominal value is the total amount on the receipt, and the real value is the quantity of items written on that receipt.
Growth rates in the news are measured using real GDP (OpenStax Principles Macroeconomics 3e 6.3). How prices are measured is covered in "Prices and Inflation — The Same Shopping Basket, Height Marks Drawn Every Year".
What Is "0.6%" Compared Against?
The economic growth rate is the percentage by which real GDP has increased compared to a previous period. Depending on what is chosen as the "previous period," the number for the same economy will change.
Quarter-on-quarter is the change compared to the immediately preceding quarter. Year-on-year is the change compared to the same quarter a year ago. For example, comparing this year's first quarter to last year's fourth quarter is quarter-on-quarter, and comparing it to last year's first quarter is year-on-year. Whether "first-quarter growth" in Korean news refers to which of the two is checked by seeing whether "quarter-on-quarter" or "year-on-year" is written alongside it in the article.
There is also a way of restating the numbers. Some countries convert quarterly growth rates into an annualized figure by asking, "If it grew at this speed for an entire year," resulting in a value multiplied by about four (OpenStax Principles Macroeconomics 3e 6.3). For example, if an economy grows 0.5% in a single quarter, stating it this way becomes roughly 2%. Therefore, when comparing growth rates from news in other countries, you must first look at how many months' worth of data is being compared against what.
Seemingly small differences like a 2% versus 3% annual growth rate compound into large differences over decades. A difference of a few percentage points each year creates a very large divergence in per-person production over several decades (OpenStax Principles Macroeconomics 3e 7.3). Running the math, an economy growing at 2% a year doubles in about 35 years, while an economy growing at 3% a year reaches about 2.8 times its size over the same period.
The news also frequently mentions the "potential growth rate." Potential GDP is the real GDP a country can produce when it utilizes all of its available labor, factories, machinery, and technology without leaving anything unused. This is a value under the premise that the country's markets and legal systems remain just as they are (OpenStax Principles Macroeconomics 3e 11.2). If actual production falls short of this level, jobs are scarce, and if demand pushes past this level, prices rise (OpenStax Principles Macroeconomics 3e) (OpenStax Principles Macroeconomics 3e 12.1). The potential growth rate refers to the speed at which this potential GDP increases.
Lastly, the growth rate announced initially is an estimate. Official growth rates are periodically revised even after they are published (DOI: 10.2139/ssrn.4618392). The value measured from the spending side and the value measured from the earning side of the same GDP sometimes diverge from one another (DOI: 10.2139/ssrn.1931651) (DOI: 10.1111/j.1467-8462.1985.tb00301.x). Therefore, it is correct to hear an initially announced growth rate as a preliminary figure that may be revised later. To put it in terms of receipts, actual statistics do not collect receipts one by one, but instead match various data sources to estimate the total.
Waves That Rise and Fall
The pile of receipts mostly grows larger with each passing year. Yet brief stretches where the pile shrinks are mixed in between. Ninety years of U.S. real GDP looks shaped just like that (OpenStax Principles Macroeconomics 3e 6.3).
If you graph the speed at which the pile accumulates, you get a wave. A wave has a trough and a peak. A trough is the bottom right before a declining economy starts rising again. A peak is the top right before an economy bends downward.
The business cycle is the movement of the economy going up and down from peak to trough, and again from trough to peak. The stretch where the wave bends downward is given the name recession. An economic recession is a period during which real GDP declines significantly. When a recession is very long and deep, it is called a depression (OpenStax Principles Macroeconomics 3e 6.3).
The news sometimes talks about "two consecutive quarters of negative growth" as if it were the rule for a recession. The textbook definition does not have a length criterion like "two quarters," and calls any period where real GDP declines significantly a recession. In the United States, a private research organization determines those start and end dates separately. The 2020 U.S. recession was a short recession lasting less than two quarters (OpenStax Principles Macroeconomics 3e 6.3).
Recessions weigh heavily because of people, not just numbers. A recession brings together people who lose their jobs and people whose wages get stuck. Deep recessions often leave marks that linger long after the recession is declared over (OpenStax Principles Macroeconomics 3e 6.3). How unemployment is measured is covered in "Unemployment and Employment — Those in Line, Those Who Left It".
The business cycle is a wave moving back and forth between peaks and troughs, and a recession is the stretch where real GDP declines significantly.
Reading a News Sentence in One Go
Let us read a sentence like this using what we have learned: "Third-quarter real GDP fell 0.2% from the previous quarter, driven largely by a sharp drop in business investment."
Since it is "real," the portion from rising prices has already been subtracted. This means the actual volume produced has fallen, not just its monetary value. Since it is "from the previous quarter," it is compared against the second quarter, and it might still be higher when compared against the third quarter of a year ago. "Business investment" refers to spending on buying new factories and machinery, and it is a category that swings much more wildly than consumption.
We cannot say that "a recession has arrived" based on this single sentence alone. It is merely a drop in a single quarter, whereas a recession refers to a period during which real GDP falls noticeably, and those exact dates are determined separately. If it is a newly released figure, it might be revised later. Even just reading "what was measured, what it was compared against, and whether prices were removed" from a single news sentence makes the numbers feel much less vague.
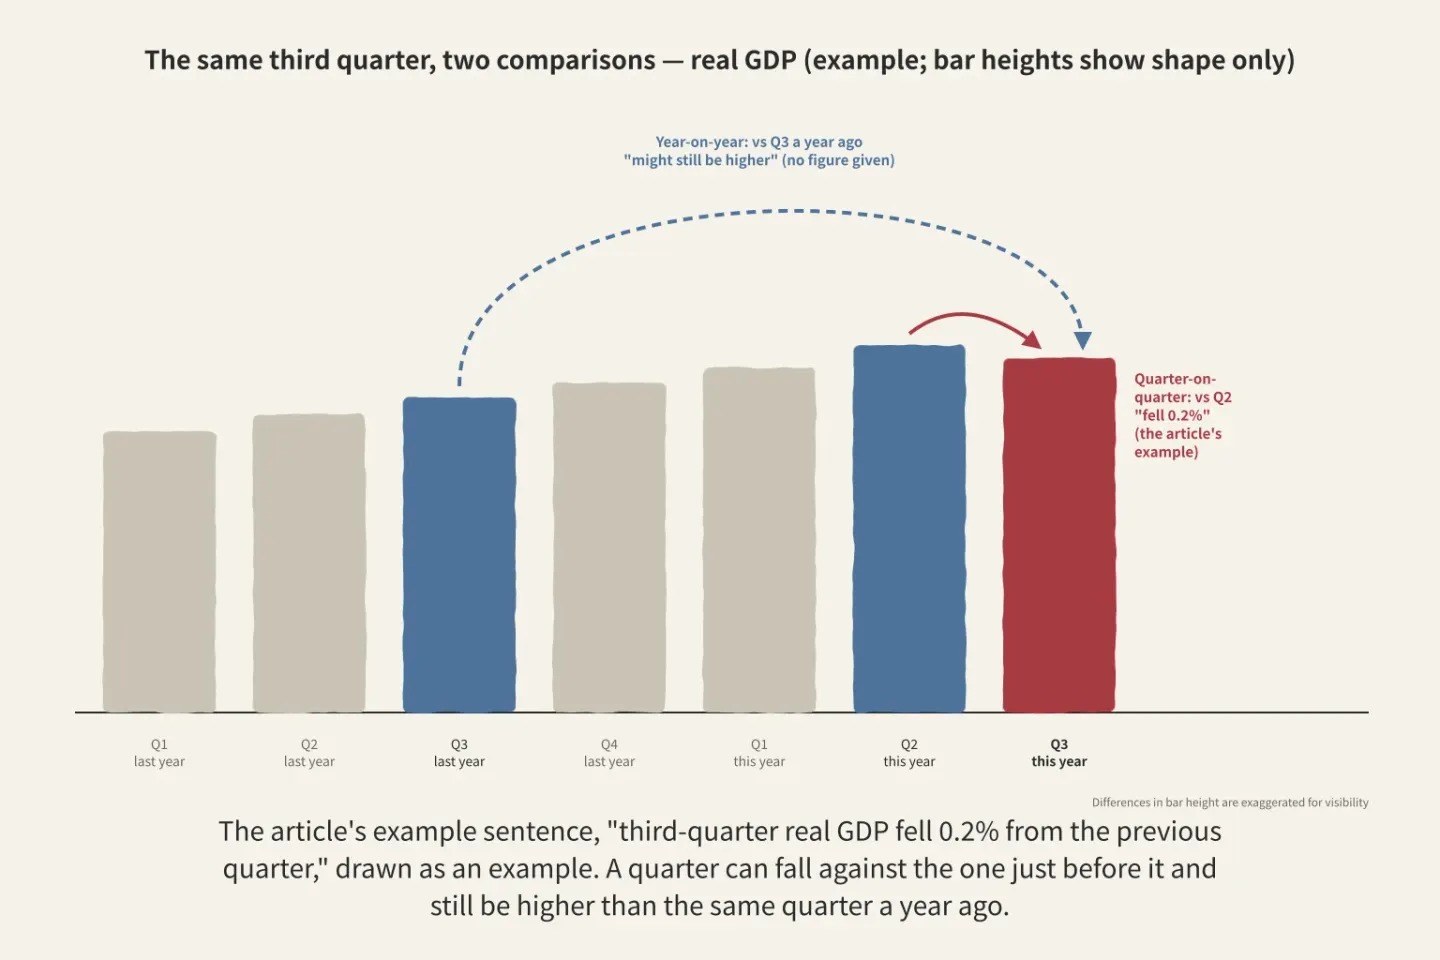
Figure: a diagram Paperis drew using only what the article says
What Division Shows, and What It Still Hides
If you compare the GDP of a country of 50 million people and a country of 500 million directly, the more populous country easily comes out ahead. That is why, when comparing living standards between countries, we divide by population (OpenStax Principles Macroeconomics 3e 6.4). GDP per capita is GDP divided by population.
There are things that become visible through division. Even if GDP grows, if the population grows faster, GDP per capita decreases. For the living standards of the average person to improve, production must grow faster than the population (OpenStax Principles Macroeconomics 3e 7.3).
There are also things that division cannot show. Because GDP per capita is an average, when the number goes up together, it cannot distinguish between a case where things improved evenly and a case where only one side improved (OpenStax Principles Macroeconomics 3e 6.5). National income is sometimes used with almost the same meaning as GDP (OpenStax Principles Macroeconomics 3e 6.1). However, when households are lined up in order of income, the actual income growth of the household right in the middle can diverge from the growth in national income per capita. While the concentration of income at the top is cited as one reason for this, it cannot be explained by that alone (DOI: 10.1093/oso/9780198807056.003.0004).
Because GDP per capita is an average, it does not tell us how it was shared.
A Day Not Found on Receipts
Let us follow the day of an office worker on their commute through the receipts they leave behind.
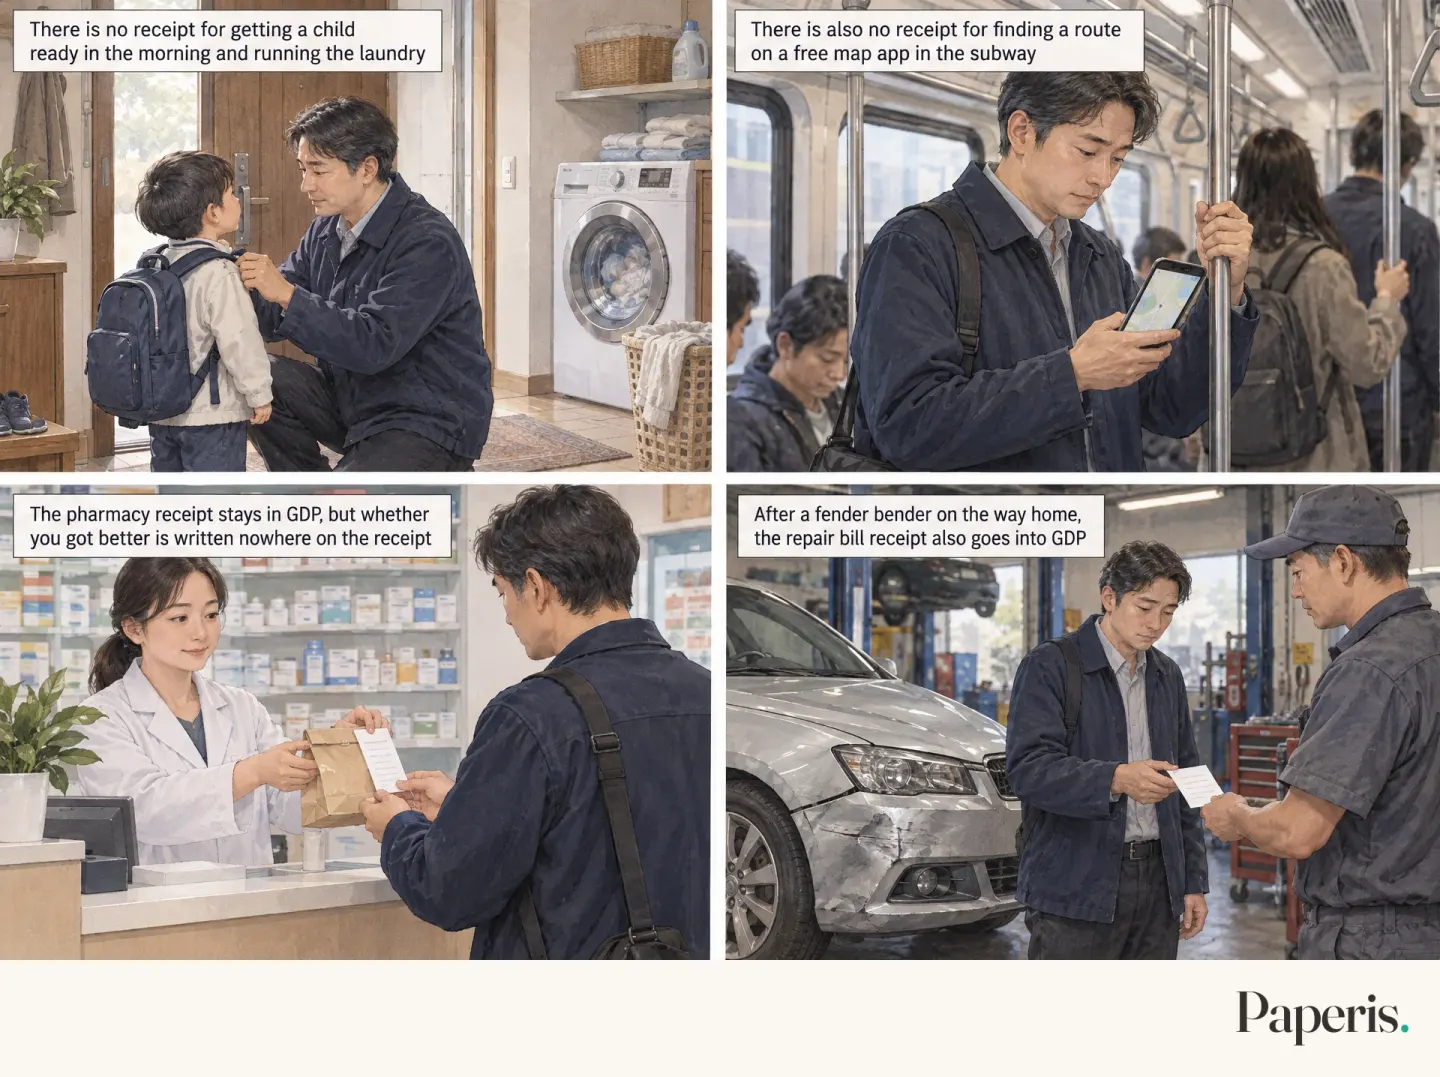
There is no receipt for getting a child ready in the morning and running the laundry. The time spent on housework and caregiving was longer for women than for men in every country surveyed. When the value of that time is added back into income and recalculated, the income gap between men and women narrows in every country, and the result varies more sharply for women depending on household structure, such as whether there is a child (European lifestyle and time-use data from six countries and the United States) (DOI: 10.1093/esr/jcac023). This is where counting only receipts reveals whose work becomes invisible.
The standards for calculating national income, even in the 2025 edition, acknowledge that housework and caregiving are important to household maintenance while keeping them outside the core accounts. Meanwhile, time-use surveys and separate satellite accounts that complement the main accounts have been growing. The author of a review synthesizing this trend concludes that this exclusion lacks a solid theoretical basis and reflects institutionalized gender bias, and they suggest that accurate measurement of housework requires further research (DOI: 10.61093/sec.9(4).176-188.2025).
There is also no receipt for finding a route on a free map app in the subway. The benefits of information handed over for free by the internet go directly to the user without passing through GDP. Pointing this out, a working paper argues that even if real GDP grows slowly, people's living conditions do not necessarily improve at the same slow pace (DOI: 10.2139/ssrn.3508557).
The receipt from stopping by a pharmacy at lunch does stay in GDP. Whether you got better from that medicine is written nowhere on the receipt. Goods made in greater quantities by working overtime are added to GDP, but the evening hours lost that day are subtracted from nowhere. GDP directly captures neither leisure time, health and education levels, nor environmental quality (OpenStax Principles Macroeconomics 3e 6).
If you got into a fender bender on your way home from work and had to fix your car, the repair bill receipt also goes into GDP. The pile of receipts grew, but life on that day was no better than before the accident (OpenStax Principles Macroeconomics 3e 6.5). This is where the receipt metaphor hits its limit. A receipt only records where money changed hands, not whether that transaction made life better.
GDP is a number that measures the size of the economy, not the size of happiness.
Yet GDP and the quality of life do not completely decouple. Countries with higher GDP per capita generally tend to have better health and education conditions (OpenStax Principles Macroeconomics 3e 6.5). A working paper examining German data (1991–2008) also found that movements in various quality-of-life indicators were largely explained by GDP and the unemployment rate. While the authors view these indicators as still useful yardsticks, they conclude that the relationship is far from perfect, leaving room to produce broader statistics alongside them (DOI: 10.2139/ssrn.1751435).
The authors of another working paper conclude that both GDP and quality-of-life indicators are important, but they answer different questions. GDP asks about the size of the economy, while quality-of-life indicators ask how much the economy actually improved people's living conditions (DOI: 10.2139/ssrn.4165312). Do not read happiness from GDP alone, do not throw GDP away, and simply read per capita values alongside other indicators.
GDP is a crude but useful number, and it is read properly when read together with other indicators.
Where to Look Next
How the inflation subtracted from the "real" in growth rate is measured continues in "Prices and Inflation — The Same Shopping Basket, Height Marks Drawn Every Year". The marks left by a recession on people are covered by "Unemployment and Employment — Those in Line, Those Who Left It", and the exchange rates and trade balance behind net exports by "Exchange Rates and Trade — A Seesaw Where One End Rises as the Other Sinks, and the People Riding Each End". The story of central banks moving interest rates to prop up the economy is in "Interest Rates and Central Banks — A Brake in the Engine Room, a Train That Slows Long After".
Why financial crises repeat among moments when the economy sharply downturns is covered by "Why Financial Crises Keep Coming Back — Fat Tails, Black Swans, and Systemic Risk". The shape of how things are shared, hidden behind the per capita average, leads to "Why Wealth Concentrates — The Physics of Inequality". Values that prices cannot fully capture, such as "whether the air has become clean", can be seen in "When Markets Fail — The Moments a Price Cannot Tell the Whole Story". The value of choices, such as whether to do housework or do something else with that time, is covered by "Scarcity and Opportunity Cost: What Do You Give Up When You Choose?".
Source Papers
- "Principles of Macroeconomics 3e — 6.1 Measuring the Size of the Economy: Gross Domestic Product" (2022) — OpenStax Principles Macroeconomics 3e 6.1 — The definition of GDP, its four demand-side pillars (investment is more volatile than consumption, government purchases only, net exports), excluding intermediate goods, excluding used goods, home production, and transfer payments, the territorial boundary criterion, and the interchangeable use of national income and GDP.
- "Principles of Macroeconomics 3e — Key Concepts and Summary" (2022) — OpenStax Principles Macroeconomics 3e 6 — Counting only final output to avoid double counting. GDP is a rough indicator that does not directly reflect leisure, environmental quality, health, and education levels.
- "Principles of Macroeconomics 3e — 6.2 Adjusting Nominal Values to Real Values" (2022) — OpenStax Principles Macroeconomics 3e 6.2 — The distinction between nominal and real values, how without knowing prices it is hard to tell what mainly drove a GDP increase, and why real values are usually more important.
- "Principles of Macroeconomics 3e — 6.3 Tracking Real GDP over Time" (2022) — OpenStax Principles Macroeconomics 3e 6.3 — Growth rates as the percentage change in real GDP, the practice of reporting quarterly growth rates on an annualized basis, the long-term rise and brief declines of U.S. real GDP, recessions, depressions, peaks, troughs, and business cycles, date determinations by U.S. private institutions, the fact that the 2020 U.S. recession was a short one lasting less than two full quarters, and the costs recessions leave on employment and the scars of deep recessions.
- "Principles of Macroeconomics 3e — 6.4 Comparing GDP among Countries" (2022) — OpenStax Principles Macroeconomics 3e 6.4 — Dividing by population when comparing living standards across countries.
- "Principles of Macroeconomics 3e — 6.5 How Well GDP Measures the Well-Being of Society" (2022) — OpenStax Principles Macroeconomics 3e 6.5 — GDP per capita is an average and thus does not speak to distribution, does not measure the actual level of non-market production, leisure, environment, health, and learning, and while a rise in GDP is not always a good thing, it is a rough yardstick of material conditions in terms of jobs and incomes, and countries with significantly higher GDP per capita usually have better other living conditions as well.
- "Principles of Macroeconomics 3e — 7.3 Components of Economic Growth" (2022) — OpenStax Principles Macroeconomics 3e 7.3 — Small differences in growth rates compounding over decades create large differences in GDP per capita, and production must grow faster than population for average conditions to improve.
- "Principles of Macroeconomics 3e — 11.2 Building a Model of Aggregate Demand and Aggregate Supply" (2022) — OpenStax Principles Macroeconomics 3e 11.2 — Potential GDP is the real GDP that can be produced when all available labor, physical capital, and technology are used.
- "Principles of Macroeconomics 3e — 12.1 Aggregate Demand in Keynesian Analysis" (2022) — OpenStax Principles Macroeconomics 3e 12.1 — When demand pushes beyond potential output, prices rise.
- "Principles of Macroeconomics 3e — Appendix B The Expenditure-Output Model" (2022) — OpenStax Principles Macroeconomics 3e — When output falls short of potential GDP (the full-employment level), unemployment arises.
- "GDP Revisions are Not Cool: The Impact of Statistical Agencies' Trade-Off" (2023) — DOI: 10.2139/ssrn.4618392 — Working paper. Official growth estimates are revised regularly, and statistical agencies revise component items more than total GDP.
- "Improving GDP Measurement: A Forecast Combination Perspective" (2011) — DOI: 10.2139/ssrn.1931651 — Working paper. U.S. expenditure-side GDP and income-side GDI estimates frequently diverge, and proposes a combined estimation of the two.
- "GDP Growth Rates Calculated from Quarterly National Accounts: Discrepancies and Revisions" (1985) — DOI: 10.1111/j.1467-8462.1985.tb00301.x — Documents the difference between income-based and expenditure-based real growth rates, and the extent to which initially reported growth rates are subsequently revised.
- "Median Household Income and GDP" (2018) — DOI: 10.1093/oso/9780198807056.003.0004 — Book chapter. Real income growth for the median household can diverge from national income growth per capita, and upper-income concentration is only one possible explanation.
- "Accounting for the Value of Unpaid Domestic Work: A Cross-National Study of Variation across Household Types" (2022) — DOI: 10.1093/esr/jcac023 — Women's unpaid labor hours exceed those of men in all countries across six European nations and the U.S., and viewing income with the value of unpaid labor added narrows the gender gap in every country.
- "Hidden Socioeconomic Challenges: A Historical Review of the Exclusion of Unpaid Household and Care Work from National Income Accounting" (2025) — DOI: 10.61093/sec.9(4).176-188.2025 — Narrative review. While SNA 2025 acknowledges that unpaid housework and care are important for material welfare, it leaves them outside the core accounts; the authors conclude that this exclusion lacks solid theoretical grounding and carries a gender bias, and consider that measurement techniques need further research.
- "Expanded GDP for Welfare Measurement in the 21st Century" (2019) — DOI: 10.2139/ssrn.3508557 — Working paper. The benefits of free information on the internet do not pass through GDP, so slower real GDP growth does not necessarily mean consumer welfare grows slowly.
- "Beyond GDP and Back: What is the Value-Added by Additional Components of Welfare Measurement?" (2011) — DOI: 10.2139/ssrn.1751435 — Working paper. In German data (1991–2008), fluctuations in various quality-of-life indicators are largely captured by GDP and unemployment rates, but the correlation is far from perfect, leaving room for broader statistics.
- "Is GDP Becoming Obsolete? The "Beyond GDP" Debate" (2022) — DOI: 10.2139/ssrn.4165312 — Working paper. GDP is an essential tool for viewing the current state of the economy but weak as a personal welfare indicator, concluding that both GDP and welfare indicators are important while answering different questions (the size of the economy vs. actual progress).
Sources (19)
- Principles of Macroeconomics 3e — 6.1 Measuring the Size of the Economy: Gross Domestic Product
- Principles of Macroeconomics 3e — Key Concepts and Summary
- Principles of Macroeconomics 3e — 6.2 Adjusting Nominal Values to Real Values
- Principles of Macroeconomics 3e — 6.3 Tracking Real GDP over Time
- Principles of Macroeconomics 3e — 6.4 Comparing GDP among Countries
- Principles of Macroeconomics 3e — 6.5 How Well GDP Measures the Well-Being of Society
- Principles of Macroeconomics 3e — 7.3 Components of Economic Growth
- Principles of Macroeconomics 3e — 11.2 Building a Model of Aggregate Demand and Aggregate Supply
- Principles of Macroeconomics 3e — 12.1 Aggregate Demand in Keynesian Analysis
- Principles of Macroeconomics 3e — Appendix B The Expenditure-Output Model
- GDP Revisions are Not Cool: The Impact of Statistical Agencies' Trade-OffDOI 10.2139/ssrn.4618392
- Improving GDP Measurement: A Forecast Combination PerspectiveDOI 10.2139/ssrn.1931651
- GDP Growth Rates Calculated from Quarterly National Accounts: Discrepancies and RevisionsDOI 10.1111/j.1467-8462.1985.tb00301.x
- Median Household Income and GDPDOI 10.1093/oso/9780198807056.003.0004
- Accounting for the Value of Unpaid Domestic Work: A Cross-National Study of Variation across Household TypesDOI 10.1093/esr/jcac023
- Hidden Socioeconomic Challenges: A Historical Review of the Exclusion of Unpaid Household and Care Work from National Income AccountingDOI 10.61093/sec.9(4).176-188.2025
- Expanded GDP for Welfare Measurement in the 21st CenturyDOI 10.2139/ssrn.3508557
- Beyond GDP and Back: What is the Value-Added by Additional Components of Welfare Measurement?DOI 10.2139/ssrn.1751435
- Is GDP Becoming Obsolete? TheDOI 10.2139/ssrn.4165312