
Paperis Articles
Prices and Inflation — The Same Shopping Basket, Height Marks Drawn Every Year
What is the 3% in "consumer prices rose 3%"? A child still gets taller in a year of slower growth — how a shopping basket measures prices, and what that basket misses.
Your field's papers, as audio
Pick your fields and journals — Paperis summarizes the key papers and turns them into audio. Listen on your commute.
Start Paperis free →Prices and Inflation — The Same Shopping Basket, Height Marks Drawn Every Year
One Shopping Basket
You put the same items into your cart at the same grocery store as last month, but the amount on the checkout screen comes out a little higher. What you put in—milk, eggs, a pack of ramen, and a bottle of detergent—remains exactly the same. On the morning economic news, the sentence "consumer prices rose by a certain percentage compared to a year ago" appears almost every month.
It is not easy to explain what this percentage is a number measuring, and why it can differ from the amount on your checkout screen. This article sets out in order the words needed to read that single sentence. The examples in this article are taken from Korean news, but the concepts apply anywhere.
The starting point is the first word of the title. The price level is the average level of the prices of various goods and services bundled together. The checkout amount is the price of one basket of mine, and the price level is a value bundled much more broadly than that.
This article follows the price level by comparing it to height markings drawn on a wall every year. In a house with children, parents have a child stand against the wall every year and draw a line with a pencil at the top of their head. The price level is the height of the mark drawn today, and the percentage delivered by the news is how much it grew from the mark drawn in the same month a year ago. Distinguishing between height and the amount grown clears up one of the most common misunderstandings in economic news.
Weighing It by Our Household Expenses
If you lay out our household monthly expenses, the share taken up by your mobile phone bill and the share spent on an umbrella are very different. When bundling prices, this difference is also factored into the calculation.
Weight is the weight attached to each item when bundling prices, and it is greater the more money people spend on that item. Various values are bundled into a single price by weighing them and taking an average (OpenStax Principles Macroeconomics 3e 9.1). Therefore, the price level moves more according to the prices of items on which people spend a lot of money.
The weight is determined by how much money is spent, not by how often you buy it (DOI: 10.36464/jrd.2026.49.2.003). This difference becomes the starting point behind "Why the Inflation I Feel Differs from the Inflation in the News".
The Shopping Cart in a Single Number
The shopping cart is the standard for weighing prices. The Consumer Price Index (CPI) is an index that compares the cost of a fixed basket of goods and services typically purchased by households to a baseline period. It sets the items and quantities to put in the cart, and measures how much it costs to buy that same cart again over time (OpenStax Principles Macroeconomics 3e 9.2). Because the contents are the same, the difference in the amount is purely the change in prices.
An index is a number that sets the value at a baseline time to 100 and expresses values at other times in comparison to it. The baseline period is the time when the index is set to 100. For example, if the index is currently 108, it means that buying the same cart costs 8% more than in the baseline period (OpenStax Principles Macroeconomics 3e 9). In terms of height marks on a ruler, the index is the height of the mark made today.
In South Korea, a government agency that compiles national statistics announces the Consumer Price Index, and the consumer price fluctuation rate is monthly data (DOI: 10.37674/CEOMS.25.1.14).
What Does "Up 3%" Mean?
When the news reports a "3 percent rise in consumer prices," it is usually comparing this month's index with the index of the same month one year ago. This means that the cost of your grocery basket has gone up 3 percent over the course of a year, not that it went up 3 percent compared to last month.
The inflation rate is a value indicating what percentage prices have risen over a certain period. Measured with the consumer price index, the percentage by which the index changed during that period is the inflation rate itself (OpenStax Principles Macroeconomics 3e 9). The inflation rate in the news is usually the change over a one-year span (OpenStax Principles Macroeconomics 3e 9.3).
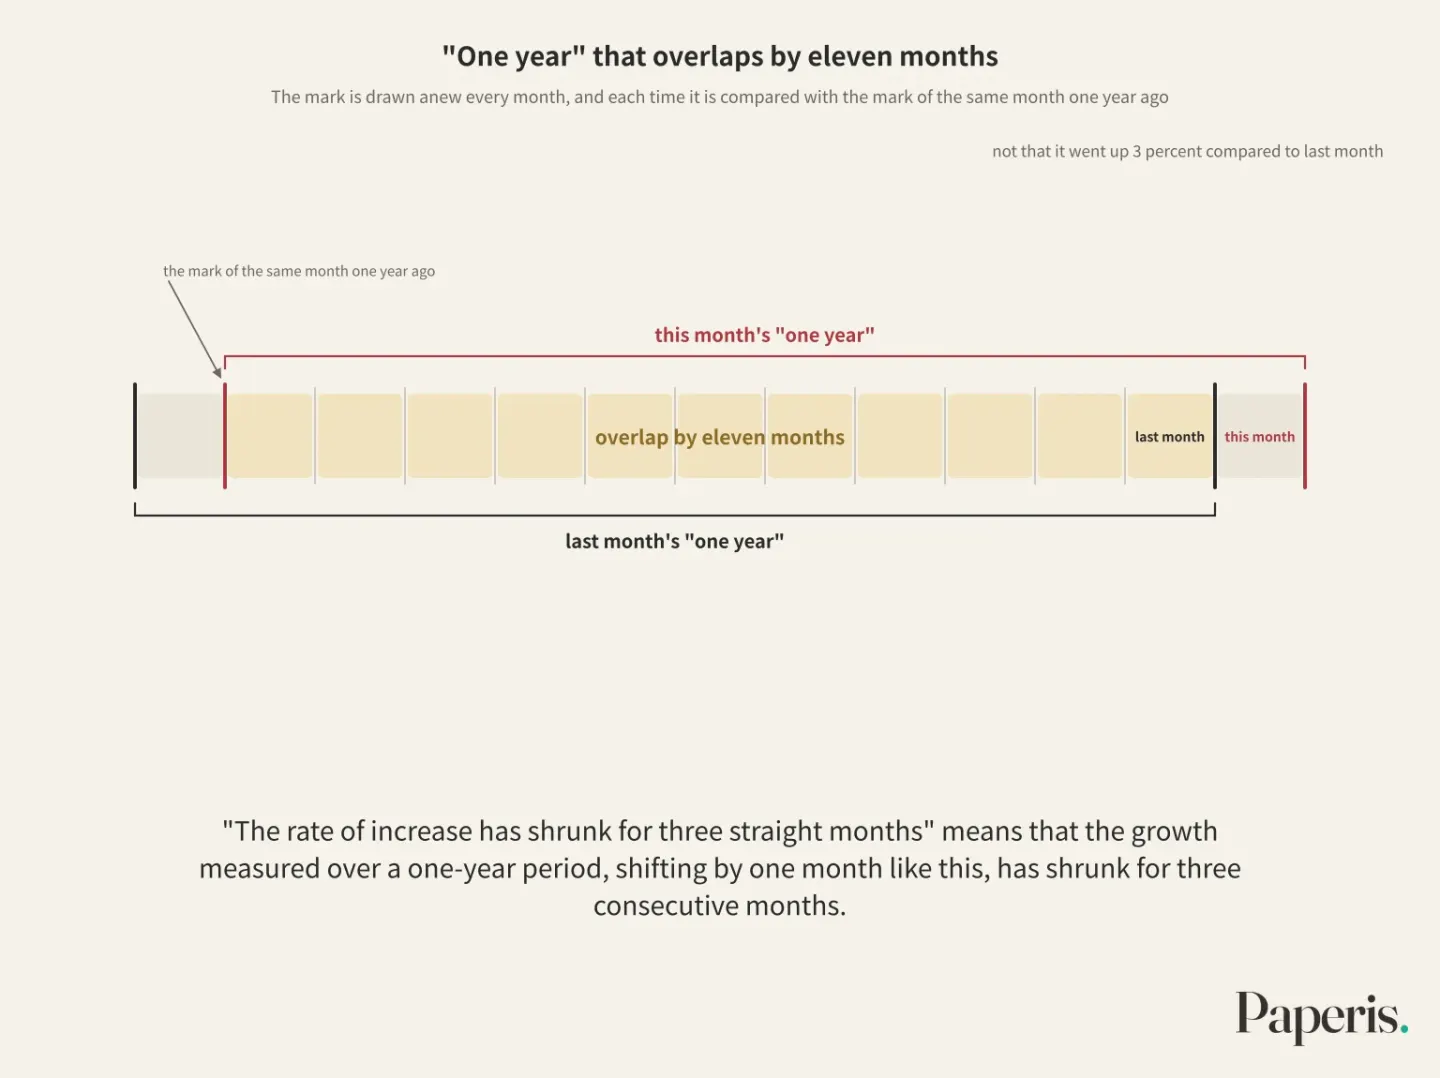
To put it in terms of height marks, the index is today's height, and the inflation rate is how much you grew from the mark of the same month one year ago. The mark is drawn anew every month, and each time it is compared with the mark of the same month one year ago. Therefore, this month's "one year" and last month's "one year" overlap by eleven months. "The rate of increase has shrunk for three straight months" means that the growth measured over a one-year period, shifting by one month like this, has shrunk for three consecutive months.
Things That Keep Rising
When only the price of napa cabbage goes up significantly, it is a cabbage-specific issue. The story changes when almost all items rise together (OpenStax Principles Macroeconomics 3e 9.1). Inflation is a phenomenon where the overall price level rises. It refers not to a one-time jump, but to a continuous rise (OpenStax Principles Macroeconomics 3e 9).
The weight of the issue differs greatly depending on how fast prices rise. Economics textbooks explain that a low single-digit percentage rise each year is far from a national crisis (OpenStax Principles Macroeconomics 3e 9.4). At the opposite end, hyperinflation is an extreme form of inflation where prices rise uncontrollably fast. In Zimbabwe in November 2008, prices roughly doubled almost every day (OpenStax Principles Macroeconomics 3e 9). At that point, the economy can break down to the extent that it cannot function properly (OpenStax Principles Macroeconomics 3e 9.4). What this article covers is much lower than that—the everyday price increases that appear in the news every month.
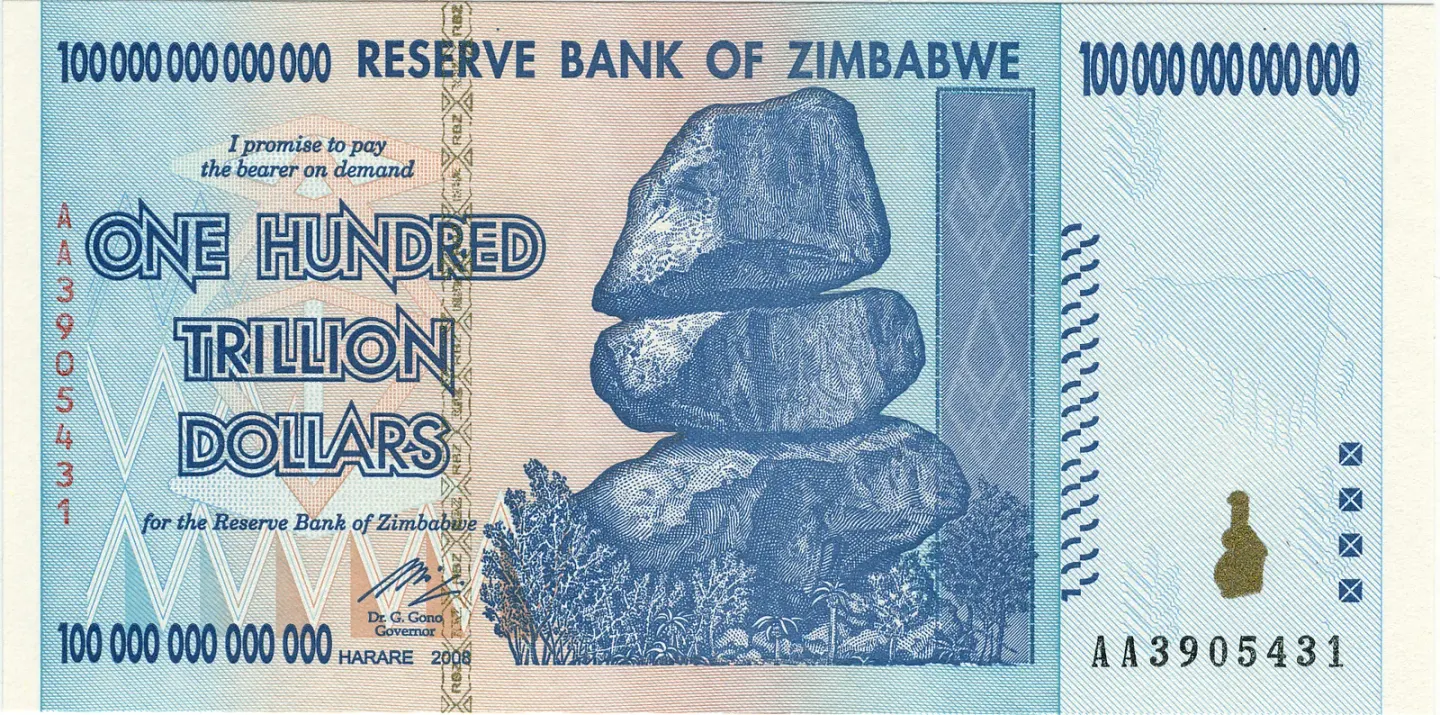
Zimbabwe 100-trillion-dollar banknote · Reserve Bank of Zimbabwe, 2009 · Wikimedia Commons (public domain)
As to why prices keep rising, debates continue over whether the center of gravity lies in the money supply, people's expectations, or supply chains, and that debate is covered in "The Real Cause of Inflation — Money Supply, Expectations, or Supply Chains?".
A Year That Grew Less, A Year That Shrank
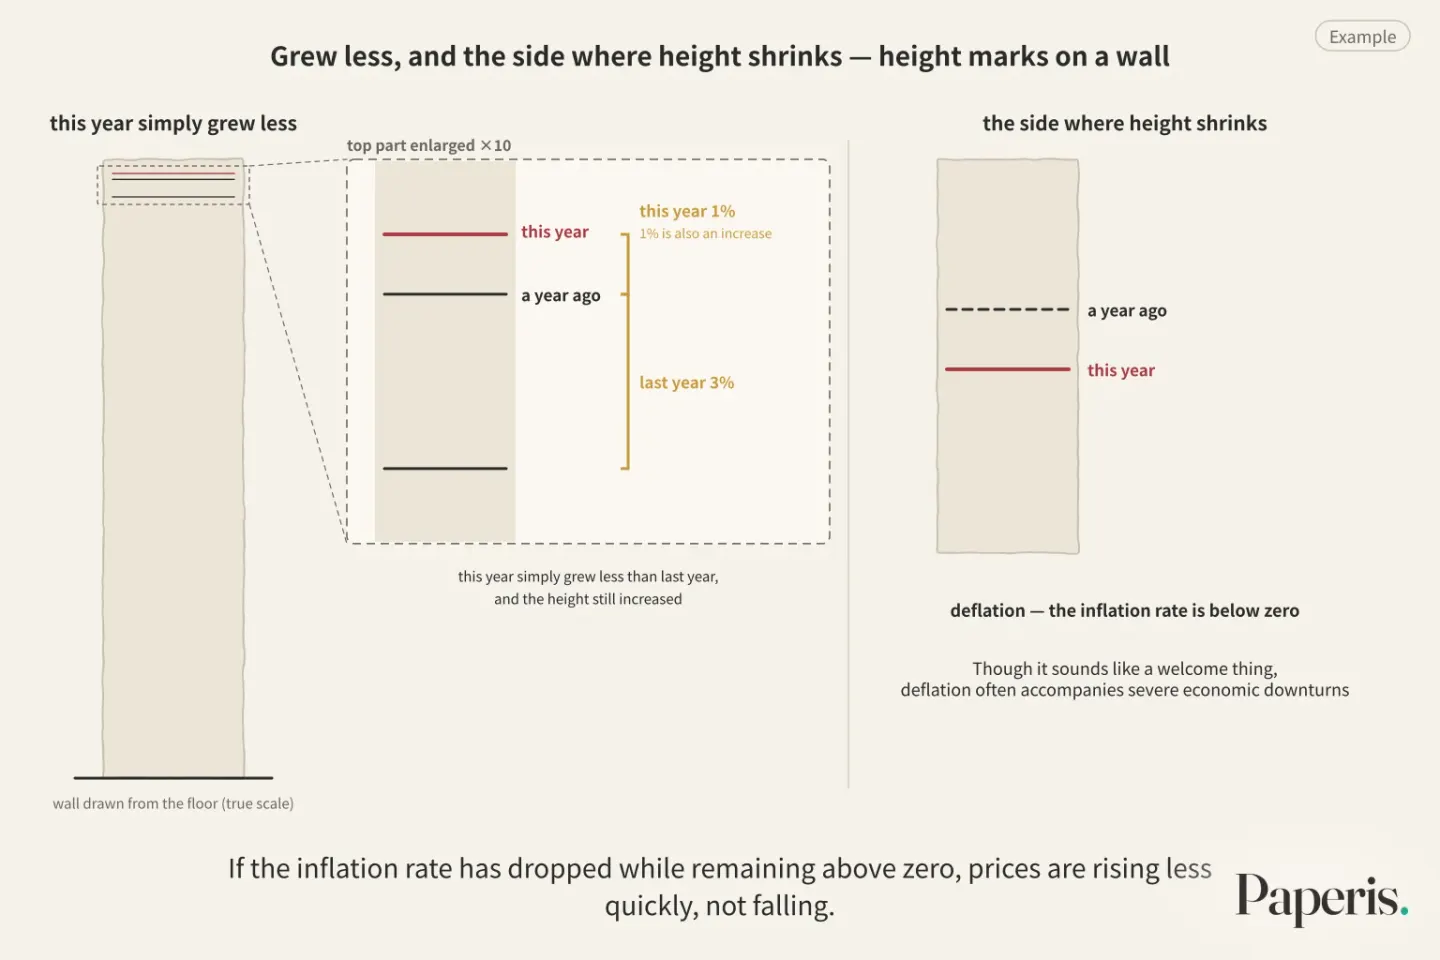
For example, let us say last year's inflation rate was 3% and this year it is 1%. The news reports that "the upward trend in prices has broken sharply," and it is easy to hear this as "prices have fallen." However, 1% is also an increase. Prices go up a little more this year on top of what went up last year.
If the inflation rate has dropped while remaining above zero, prices are rising less quickly, not falling. Disinflation is the lowering of the inflation rate. Economics textbooks also use this term to mean a fall in the rate of inflation (OpenStax Principles Macroeconomics 3e 13.1). While the inflation rate is above zero, prices are still rising, just less quickly. In terms of height marks on a wall, this year simply grew less than last year, and the height still increased.
It is frequently discussed that even during periods when the inflation rate goes down, people do not feel that household finances have improved. From February 2023 to February 2026 in Turkey, even while the official inflation rate went down, households did not feel that things improved by that much. A working paper examining this interprets that people based their judgment on the fact that rising prices were spread widely across many different categories of items (DOI: 10.2139/ssrn.6844219).
There is also the side where height shrinks. Deflation is a general fall in prices, meaning a state where the inflation rate is below zero. During deflation, what you can buy with the same amount of money increases (OpenStax Principles Macroeconomics 3e 9.3).
Though it sounds like a welcome thing, deflation often accompanies severe economic downturns. Economics textbooks consider low inflation to be better than deflation (OpenStax Principles Macroeconomics 3e 9.4).
Even Though My Salary Went Up
For example, suppose your salary went up a little over the course of a year, but prices went up even more. The number printed in your bank account increased, but the shopping cart you can fill with that money has gotten smaller than it was a year ago.
Purchasing power is the amount of goods and services you can buy with the same amount of money. When inflation continues, the purchasing power of the same money shrinks (OpenStax Principles Macroeconomics 3e 9.1). That is why we use two scales when looking at amounts of money.
Nominal value is the exact amount of money written down without subtracting price changes. Real value is the amount measured after subtracting the portion by which prices have risen. The salary above went up in nominal terms, but went down in real terms once you subtract the portion by which prices rose.
When "real wages" or "real income" appear in the news, these are values with the price increase subtracted. "GDP and the Business Cycle — The Last Receipt, and the Day No Receipt Records" uses the same method when measuring the size of the entire economy, and the portion left when subtracting inflation from interest is covered in "Interest Rates and Central Banks — A Brake in the Engine Room, a Train That Slows Long After".
Who Loses Out
It is relatively well known that when prices rise, the purchasing power of assets like savings is chipped away. In a working paper looking at unexpected inflation during a period of unprecedented price hikes, households generally knew a lot about the price situation and that their assets were being chipped away, but most did not know that the weight of their debt also decreased. When this was pointed out to them, people calculated their inflation-adjusted wealth higher, and their actual consumption changed as well (DOI: 10.2139/ssrn.4722144).
The reason debt becomes lighter lies in the difference in how fast things rise. If the speeds at which prices, salaries, and interest rates keep up with inflation differ from one another, inflation transfers purchasing power from one side to the other (OpenStax Principles Macroeconomics 3e 9.4).
A person who borrowed money at a fixed interest rate is an example of this. If prices rise more than expected at the time of borrowing, the amount to be repaid stays the same, but the purchasing power of that money shrinks, making the burden of repayment lighter (OpenStax Principles Macroeconomics 3e 9.4). This gain applies when the interest rate is fixed and inflation exceeds expectations. Debt where the interest rate changes along with the market is covered in "Interest Rates and Central Banks — A Brake in the Engine Room, a Train That Slows Long After".
On the receiving end of money, setting that money to automatically rise alongside prices reduces losses (OpenStax Principles Macroeconomics 3e 9.5). In a policy memo covering Malta, where prices rose sharply starting in mid-2021, the inflation rates experienced by low-income and retired households were higher than those of wealthy and young households. Pensions alone could not protect purchasing power, but adding inflation-adjusted supplemental payments more than made up for the loss (DOI: 10.2139/ssrn.4689636).
One fork in the road dividing loss and gain is how quickly the money you receive and the money you repay keep pace with prices. Another fork in the road is the shopping basket, which differs from household to household.
Different Height Marks in Every Home
The grocery baskets of a household with children, a single retiree, and a person commuting by car are all different. Because the share of money spent on each item varies, the rate at which prices rise differs from home to home even in the same month. According to a working paper looking at French and German households, the differences in inflation rates experienced by each household were large and persisted for a long time. The major causes were that even for the same item, prices varied depending on the region where it was bought, and what was chosen within the same category (DOI: 10.2139/ssrn.4711249).
Whether lower-income households experience higher inflation depends on the time period and the categories of goods. In Australia from 2011 to 2018, the lowest-income households experienced the highest inflation rate, but the entire difference came from the prices of alcohol and tobacco, and when those two were excluded, there was almost no difference according to income (DOI: 10.1111/1475-4932.12575). In a working paper looking at purchase records of Austrian households, income did not usually create a large divide in inflation differences, but during periods when prices rose steeply, the lowest-income group experienced higher inflation rates (DOI: 10.2139/ssrn.4708141).
The weight of the official index also tilts slightly to one side. The consumer price index can be seen as an average of each household's inflation weighted by how much that household spent, meaning the grocery baskets of households that spend more money are reflected more heavily (DOI: 10.5089/9781451847949.001). In a 1990s International Monetary Fund working paper measuring Spain, the difference from an index giving equal weight to all households canceled out overall across the entire period, but the differences from moment to moment were larger than that (DOI: 10.5089/9781451858174.001).
Official inflation is a number measuring the average household's grocery basket. Depending on how much your grocery basket differs from the average, the height mark on our home's wall rises faster or slower than the one in the news.
What the Shopping Basket Misses
People do not simply keep buying items whose prices have gone up; they also change the things they put in their baskets. In the Austrian working paper mentioned earlier, households significantly reduced the price increases they experienced by changing what they bought (DOI: 10.2139/ssrn.4708141). A fixed basket cannot capture this kind of substitution.
Substitution bias is a distortion where a fixed shopping basket fails to capture people buying alternative items instead of those whose prices have risen, causing it to measure the increase in the cost of living as larger than it actually is. Economics textbooks define this bias as overstating increases in the cost of living (OpenStax Principles Macroeconomics 3e 9).
When goods are replaced by new models, the price increase is a mix of the improved quality share and the price increase itself. A study that separated these two using Canadian data found that when models changed, the quality share of the price increase was less than one-third, and viewed that way, quality bias was not a major reason why official price indexes mismeasured inflation (DOI: 10.1111/caje.12238).
Quality and new-goods bias is a distortion where a shopping basket fails to fully capture improvements in goods or the introduction of new goods, causing it to measure the increase in the cost of living as larger than it actually is. Updating the basket in a timely manner can reduce these two biases, but cannot eliminate them entirely (OpenStax Principles Macroeconomics 3e 9).
How large the bias of the overall official index actually was varied depending on the time period. In a study measured using Korean household data, the Korean Consumer Price Index overstated the cost-of-living increase by about 0.7% per year from 2000 to 2005, and the authors added that part of this is explained by issues in measuring the purchasing power of imported and exported goods (DOI: 10.2139/ssrn.3078341). A re-examination using the same method for 1990–2024 showed that this overstatement appeared before 2010 but was hardly seen afterwards (DOI: 10.22841/kefdoi.2025.18.2.003).
Studies in other countries measured using similar methods reported that the official indexes of Canada and Australia overstated the cost-of-living increase over roughly twenty years (DOI: 10.1111/j.0008-4085.2005.00289.x) (DOI: 10.1111/j.1475-4932.2009.00594.x). A study looking at Poland reported, unlike most studies, that the official index actually understated price increases, and suggested that frequent updates to weights may be one reason why it was not overstated (DOI: 10.1556/032.2023.00022).
Studies across multiple countries generally found that official indexes slightly overstate the increase in the cost of living, but the magnitude varies depending on the time period and measurement method, and opposite results also exist. This bias is an inherent limitation of measuring dynamic households with a fixed basket.
Why It Feels Like It Rose More
Grocery prices often feel higher than the official numbers. In a study surveying consumers about Korean food prices, the vast majority perceived the inflation they felt as higher than the official food price index (DOI: 10.36464/jrd.2020.43.1.003). Perceived inflation is the degree of price increases that people feel for themselves. In the same study, the more frequently people bought groceries, the larger the gap between official prices and perceived inflation.
In another study measuring perceived grocery inflation through surveys from 2021 to 2023, consumers consistently felt food prices were higher than the official figures, and that gap widened during periods of high inflation (DOI: 10.24997/KJAE.2025.66.2.1).
There is also research that changed how weights are assigned. Looking at a dining-table price index created by giving more weight to frequently purchased items in a study, the prices of essential groceries bought often swung significantly, and this index moved more sharply than official prices weighted by spending amounts (DOI: 10.36464/jrd.2026.49.2.003).
The same pattern is reported in other countries. A working paper looking at Indian households interprets the gap where perceived inflation was higher than the official growth rate across surveys from 2024 to 2025 as a systematic bias rather than randomness or foolishness, suggesting that food and fuel, whose prices fluctuate wildly, capture people's attention (DOI: 10.2139/ssrn.6943058).
Official inflation measures the entire basket of goods weighted by spending amounts, while people's attention easily gravitates toward prices they encounter frequently. In the survey studies above, perception was higher than the official numbers, and that gap widened when inflation was high. Even in a working paper that constructed an index giving more weight to items that draw attention, this index moved alongside official inflation while fluctuating more sharply over short periods (DOI: 10.2139/ssrn.6975649).
The news also features a gauge looking at the opposite side. Core inflation is measured by excluding items with large price fluctuations from the consumer price index. It is a gauge meant to filter out prices that leap and drop temporarily in order to see long-term trends. Textbooks give food and energy as examples of excluded items (OpenStax Principles Macroeconomics 3e 9), and in Korea, excluding agricultural products and petroleum products has commonly been used as the standard for core inflation (DOI: 10.23895/kdijep.2010.32.3.1).
Among the items excluded from core inflation are some of the food and fuel that drive up perceived inflation. Because of this, news saying "core inflation is stable" and the feeling that grocery shopping is burdensome can appear in the same month. The two gauges look at different things.
Rereading a News Sentence in a New Light
Let us suppose that a sentence like this appeared in the morning news: "Last month's consumer prices rose 2.0% compared to a year ago, with the rate of increase narrowing for three consecutive months. Core inflation, which excludes agricultural products and petroleum, rose a little more than that." The numbers are a fabricated example.
"Consumer prices" is usually an index representing the cost of an average household's shopping basket. "2.0% compared to a year ago" means that the notch drawn last month is that much higher than the notch from the same month a year ago. "The rate of increase narrowing" means that the gap being compared each month has been shrinking for three consecutive months. Throughout those three months, the index was higher than a year ago, so prices were still rising.
The fact that core inflation rose more than the overall rate means that the prices of the agricultural products and petroleum that were excluded rose less than the rest. If our household's lived experience that same month feels different, it may be because our household shopping basket differs from the average, or because the items we buy frequently went up unusually. If your paycheck grew less than that over the span of a year, it has effectively shrunk.
The height-notch analogy has limits. A child's height will eventually stop growing, but there is no set time for prices to stop. And while height belongs to a single person, prices are an average, so even in a year when the notch went up, the price of some goods within it may have gone down. Being above the notch from a year ago also does not erase the possibility that the price briefly dropped in some month in between. A child's height does not decrease, but prices can go down, and the numbers in the news are ratios, not grown lengths. Growing taller is a welcome thing, but there is no reason to hear prices rising in the same sense.
Prices are the height of an average measured by a shopping basket, and the percentage in the news is how much that height has gone up compared to the same month a year ago. Because that shopping basket belongs to the average household and cannot capture all substitutions and quality changes, official inflation is a number that must be read knowing what it counts and what it leaves out.
Where to Look Next
Why prices rise, and whether the amount of money, people's expectations, or supply chains are at the center, is covered in "The Real Cause of Inflation — Money Supply, Expectations, or Supply Chains?". How the individual prices that make up the price level are determined can be seen in "Supply and Demand: Who Sets the Price?".
"Interest Rates and Central Banks — A Brake in the Engine Room, a Train That Slows Long After" covers how central banks move interest rates to stabilize prices and discusses interest minus inflation. "GDP and the Business Cycle — The Last Receipt, and the Day No Receipt Records" covers how to measure the size of the economy after subtracting the portion by which prices have risen, and "Exchange Rates and Trade — A Seesaw Where One End Rises as the Other Sinks, and the People Riding Each End" traces the path by which exchange rates translate into prices.
Source Papers
- "Principles of Macroeconomics 3e — 9.1 Tracking Inflation" (2022) — OpenStax Principles Macroeconomics 3e 9.1 — Bundles various values into a single price level by taking a weighted average based on the quantities people actually buy, where price increases are part of a general price rise, and accumulated inflation reduces the purchasing power of the same money.
- "Principles of Macroeconomics 3e — 9.2 How to Measure Changes in the Cost of Living" (2022) — OpenStax Principles Macroeconomics 3e 9.2 — The Consumer Price Index is measured by the cost of a fixed basket of goods and quantities.
- "Principles of Macroeconomics 3e — Key Terms" (2022) — OpenStax Principles Macroeconomics 3e 9 — Definitions of the base year (index 100), index, inflation (a general and ongoing rise in prices), deflation, hyperinflation, substitution bias and quality/new-goods bias (which overestimate the rise in the cost of living), and the core inflation index (excluding volatile items like food and energy).
- "Principles of Macroeconomics 3e — Key Concepts and Summary" (2022) — OpenStax Principles Macroeconomics 3e 9 — The inflation rate is the percentage change in the price level or index, and while the two biases of a fixed basket can be reduced by revising the basket, they cannot be entirely eliminated.
- "Principles of Macroeconomics 3e — 9.3 How the U.S. and Other Countries Experience Inflation" (2022) — OpenStax Principles Macroeconomics 3e 9.3 — Inflation measured by the Consumer Price Index is the annual percentage change in the cost of the basket, and during deflation, the purchasing power of money increases.
- "Principles of Macroeconomics 3e — 9.4 The Confusion Over Inflation" (2022) — OpenStax Principles Macroeconomics 3e 9.4 — If prices, wages, and interest rates adjust to inflation at different speeds, purchasing power is redistributed; if prices rise further after a fixed-interest loan is taken, the borrower's real burden decreases; low inflation is far from a national crisis, whereas hyperinflation destroys the economy; and low inflation is better than deflation accompanied by a severe slump.
- "Principles of Macroeconomics 3e — 9.5 Indexing and Its Limitations" (2022) — OpenStax Principles Macroeconomics 3e 9.5 — Automatically adjusting (indexing) prices, wages, and interest rates to match inflation reduces the pain of inflation.
- "Principles of Macroeconomics 3e — Introduction to Inflation" (2022) — OpenStax Principles Macroeconomics 3e 9 — Hyperinflation is an extreme form of inflation, and in Zimbabwe in November 2008, prices roughly doubled almost every day.
- "Principles of Macroeconomics 3e — 13.1 The Building Blocks of Neoclassical Analysis" (2022) — OpenStax Principles Macroeconomics 3e 13.1 — Disinflation is a decrease in the rate of inflation.
- "A Study on the Relationship Between Price Changes and Core Inflation Since 1991" (2022) — DOI: 10.37674/CEOMS.25.1.14 — Analyzes the relationship among three indicators—monthly consumer price fluctuation rates, producer price fluctuation rates, and core inflation rates—from January 1991 to July 2021.
- "The Blind Spot in the Fight Against Inflation: The Perceived Inflation Gap" (2026) — DOI: 10.2139/ssrn.6844219 — A working paper interpreting that in Turkey from February 2023 to February 2026, even while official inflation rates fell, households did not perceive a corresponding improvement, and the degree to which price increases spread across items acted as the households' benchmark.
- "Households' Response to the Wealth Effects of Inflation" (2024) — DOI: 10.2139/ssrn.4722144 — During unexpected inflation in a period of unprecedented inflation, households were aware of the inflation situation and the erosion of their nominal assets, but mostly unaware of the erosion of their nominal liabilities; when informed of this, their estimates of real net worth rose and their actual consumption changed (working paper).
- "The Cost of Inflation: How Has the Recent Surge in Inflation Impacted Lower-Income Households in Malta?" (2024) — DOI: 10.2139/ssrn.4689636 — Since mid-2021 in Malta, the inflation rate for lower-income and retired households was higher than for wealthy and younger households, and while pensions alone could not protect purchasing power, additional payments and cost-of-living indexation mechanisms more than made up for the losses (policy memo).
- "Inflation Heterogeneity Across Households" (2024) — DOI: 10.2139/ssrn.4711249 — Differences in inflation rates across households in France and Germany are large and persistent, and their main sources are regional price differences for the same products and differences in choices within product categories (working paper).
- "Inflation Variability Across Australian Households: Implications for Inequality and Indexation Policy*" (2020) — DOI: 10.1111/1475-4932.12575 — In Australia from 2011 to 2018, the lowest-income households experienced the highest inflation rate, but the entire difference came from alcohol and tobacco; once those were excluded, there was virtually no difference across the income distribution.
- "Inflation Heterogeneity Across Austrian Households. Evidence from Household Scanner Data" (2024) — DOI: 10.2139/ssrn.4708141 — Austrian household scanner data shows that price differences across households are large and persistent, that active product substitution allowed households to significantly reduce their exposure to inflation, and that while income has no clear effect in normal times, the lowest-income group experienced higher inflation rates during periods of high inflation (working paper).
- "Whose Inflation? A Characterization of the CPI Plutocratic Bias" (2001) — DOI: 10.5089/9781451847949.001 — The Consumer Price Index of statistical agencies can be interpreted as an average of household-specific price indices weighted by each household's total expenditure (IMF working paper).
- "The Plutocratic Bias in the CPI" (2000) — DOI: 10.5089/9781451858174.001 — In 1990s Spain, the difference between the official index and an index giving equal weight to all households offset each other in positive and negative signs over the entire period, but the mean absolute deviation was larger than that (IMF working paper).
- "Is there a quality bias in the Canadian CPI? Evidence from microdata" (2016) — DOI: 10.1111/caje.12238 — In Canadian data, the quality improvement share of price increases during model replacements was less than one-third, and using Bils' method, quality bias is not a major source of mismeasurement in the Canadian Consumer Price Index.
- "Estimation of CPI Bias in Korea and Implications for International Price Comparisons" (2017) — DOI: 10.2139/ssrn.3078341 — Applying the Engel curve method to the Korea Labor and Income Panel Study from 2000 to 2005, the upward bias of the Korean Consumer Price Index was estimated at roughly 0.7% per annual average, part of which is explained by the inadequate measurement of the real purchasing power of tradables (SSRN posted version, reposting of journal-published research).
- "An Exploratory Study on Consumer Price Index Bias" (2025) — DOI: 10.22841/kefdoi.2025.18.2.003 — Estimated using the Household Income and Expenditure Survey from 1990 to 2024 and Hamilton's method, there was a Consumer Price Index bias overestimating the cost of living prior to 2010, but it is difficult to observe after 2010.
- "Using Engel curves to estimate bias in the Canadian CPI as a cost of living index" (2005) — DOI: 10.1111/j.0008-4085.2005.00289.x — From 1978 to 2000, the Canadian Consumer Price Index overestimated changes in the cost of living by 1.33% to 1.86% across four household types.
- "Using Engel Curves to Estimate the Bias in the Australian CPI*" (2010) — DOI: 10.1111/j.1475-4932.2009.00594.x — The Australian Consumer Price Index overestimated general cost-of-living changes by 34% from 1975/76 to 2003/04.
- "Inflation measurement in times of large consumption shifts – Evidence of the CPI bias from Poland" (2023) — DOI: 10.1556/032.2023.00022 — Contrary to most literature, Poland's official Consumer Price Index underestimated inflation, and frequent weight adjustments may be why there is no overestimation.
- "The Impact of Individual Characteristics on the Discrepancy Between the Food Price Index and Consumers' Perceived Inflation" (2020) — DOI: 10.36464/jrd.2020.43.1.003 — The majority of consumers perceive perceived inflation to be higher than the food price index, and the discrepancy narrowed as the frequency of grocery purchases decreased.
- "Measurement of Grocery Basket Perceived Inflation and Analysis of Its Impact on Dietary Satisfaction" (2025) — DOI: 10.24997/KJAE.2025.66.2.1 — Measured using survey data from 2021 to 2023, grocery basket perceived inflation showed that consumers consistently perceived food prices to be higher than official figures, and the gap widened during periods of high inflation.
- "How Do Consumers' Perceived Dining Table Prices Differ from Official Prices?" (2026) — DOI: 10.36464/jrd.2026.49.2.003 — Purchase frequency weights and expenditure weights are distinctly different, price fluctuations for frequently bought essential groceries are large, and the dining table price index is more volatile than official prices, with the gap between the two widening significantly during rising periods.
- "Global Financial Crisis and Inflation Targeting Evaluation: Focusing on Core Inflation" (2010) — DOI: 10.23895/kdijep.2010.32.3.1 — Korea's conventional core inflation excludes temporary supply shocks from agricultural and petroleum products, and based on this, the 2007–09 inflation target appeared to have been met, but the picture changes when viewed through structural core inflation.
- "Inflation Illusion: Are Indian Households Rational Economic Agents?" (2026) — DOI: 10.2139/ssrn.6943058 — Indian households' perceived inflation from 2024 to 2025 was higher than the official growth rate every time, and the gap is a systematic bias relying on actual purchases, memory, and attention, with food and fuel occupying that attention (working paper).
- "The Perceived Inflation Wedge" (2026) — DOI: 10.2139/ssrn.6975649 — The attention-weighted perceived inflation index shows a high correlation with consumer price inflation, but with greater short-term volatility (NBER working paper).
Sources (30)
- Principles of Macroeconomics 3e — 9.1 Tracking Inflation
- Principles of Macroeconomics 3e — 9.2 How to Measure Changes in the Cost of Living
- Principles of Macroeconomics 3e — Key Terms
- Principles of Macroeconomics 3e — Key Concepts and Summary
- Principles of Macroeconomics 3e — 9.3 How the U.S. and Other Countries Experience Inflation
- Principles of Macroeconomics 3e — 9.4 The Confusion Over Inflation
- Principles of Macroeconomics 3e — 9.5 Indexing and Its Limitations
- Principles of Macroeconomics 3e — Introduction to Inflation
- Principles of Macroeconomics 3e — 13.1 The Building Blocks of Neoclassical Analysis
- 1991년 이후 물가의 변화와 근원인플레이션간의 연관성에 관한 연구DOI 10.37674/ceoms.25.1.14
- The Blind Spot in the Fight Against Inflation: The Perceived Inflation GapDOI 10.2139/ssrn.6844219
- Households' Response to the Wealth Effects of InflationDOI 10.2139/ssrn.4722144
- The Cost of Inflation: How Has the Recent Surge in Inflation Impacted Lower-Income Households in Malta?DOI 10.2139/ssrn.4689636
- Inflation Heterogeneity Across HouseholdsDOI 10.2139/ssrn.4711249
- Inflation Variability Across Australian Households: Implications for Inequality and Indexation PolicyDOI 10.1111/1475-4932.12575
- Inflation Heterogeneity Across Austrian Households. Evidence from Household Scanner DataDOI 10.2139/ssrn.4708141
- Whose Inflation? A Characterization of the CPI Plutocratic BiasDOI 10.5089/9781451847949.001
- The Plutocratic Bias in the CPIDOI 10.5089/9781451858174.001
- Is there a quality bias in the Canadian CPI? Evidence from microdataDOI 10.1111/caje.12238
- 한국의 소비자물가지수 편의 추정과 국제물가비교에 대한 시사점 (CPI Bias in Korea)DOI 10.2139/ssrn.3078341
- 소비자물가지수 편의에 관한 시론적 연구DOI 10.22841/kefdoi.2025.18.2.003
- Using Engel curves to estimate bias in the Canadian CPI as a cost of living indexDOI 10.1111/j.0008-4085.2005.00289.x
- Using Engel Curves to Estimate the Bias in the Australian CPIDOI 10.1111/j.1475-4932.2009.00594.x
- Inflation measurement in times of large consumption shifts – Evidence of the CPI bias from PolandDOI 10.1556/032.2023.00022
- 개인의 특성이 식품물가지수와 소비자체감물가 간의 차이에 미치는 영향DOI 10.36464/jrd.2020.43.1.003
- 장바구니 체감물가의 측정과 식생활 만족도에 대한 영향 분석DOI 10.24997/kjae.2025.66.2.1
- 소비자가 체감하는 밥상 물가는 공식 물가와 어떻게 다른가?DOI 10.36464/jrd.2026.49.2.003
- 글로벌 금융위기와 물가안정목표제 평가: 근원인플레이션을 중심으로DOI 10.23895/kdijep.2010.32.3.1
- Inflation Illusion: Are Indian Households Rational Economic Agents?DOI 10.2139/ssrn.6943058
- The Perceived Inflation WedgeDOI 10.2139/ssrn.6975649