
Paperis Articles
Unemployment and Employment — Those in Line, Those Who Left It
Who the unemployment rate counts and who it leaves out, and how to read "unemployment fell" alongside the employment rate
Your field's papers, as audio
Pick your fields and journals — Paperis summarizes the key papers and turns them into audio. Listen on your commute.
Start Paperis free →Unemployment and Employment — Those in Line, Those Who Left It
A Single Sentence in the Morning News
On the commute to work, the radio announces, "Last month's unemployment rate fell." It sounds like good news. Yet in that very same month, the number of employed people may not have increased by even one. That is because the person who pushed that number down could be someone who got a job—or someone who gave up looking for one.
This article follows that process by comparing it to a line in front of a shop door. The people who got a job work inside the door, and the people looking for work stand in line in front of the door. The examples are taken from Korean news, but the concepts apply in any country.
Only Those Standing in Line Are Counted
The unemployment rate is the percentage of people without a job among those who are either working or looking for work. The denominator is the sum of the people inside the door and the people standing in line, and it is not the value divided by all adults in the country (OpenStax Principles Macroeconomics 3e 8.1).
Therefore, not everyone without a job is counted as unemployed. Even without a job, if someone is not looking, they are not a person standing in line (OpenStax Principles Macroeconomics 3e 8.1).
The unemployed are people who do not have a job, are available for work, and have recently looked for work. All three conditions must be met to be counted as someone standing in line. If even one is missing, someone without a job is not unemployed (OpenStax Principles Macroeconomics 3e 8).
The employed are people who worked during the survey reference period. Because working even a short time makes someone employed, a part-time job of a few hours a week also counts toward those inside the door (OpenStax Principles Macroeconomics 3e 8.1).
The labor force is the total of the employed and the unemployed. It is the group combining the people inside the door and the people standing in line, and this is precisely the denominator of the unemployment rate (OpenStax Principles Macroeconomics 3e 8.1). Those not in the labor force are people of working age who are neither working nor looking for work. In South Korea, the government agency responsible for national statistics produces these figures through the Economically Active Population Survey. It is a survey asked of households chosen as a sample, and since 2005, a method has been used where sample households are slightly changed every month and the same household is surveyed repeatedly for 3 years (KCI ART001318450).
The line metaphor has limits. Actual job hunting is not standing in a single line waiting for one's turn, and those who got in line first do not enter first either. Being outside the line does not mean lacking the desire to work. Those people will appear again two sections later.
Counting with a Village of One Hundred
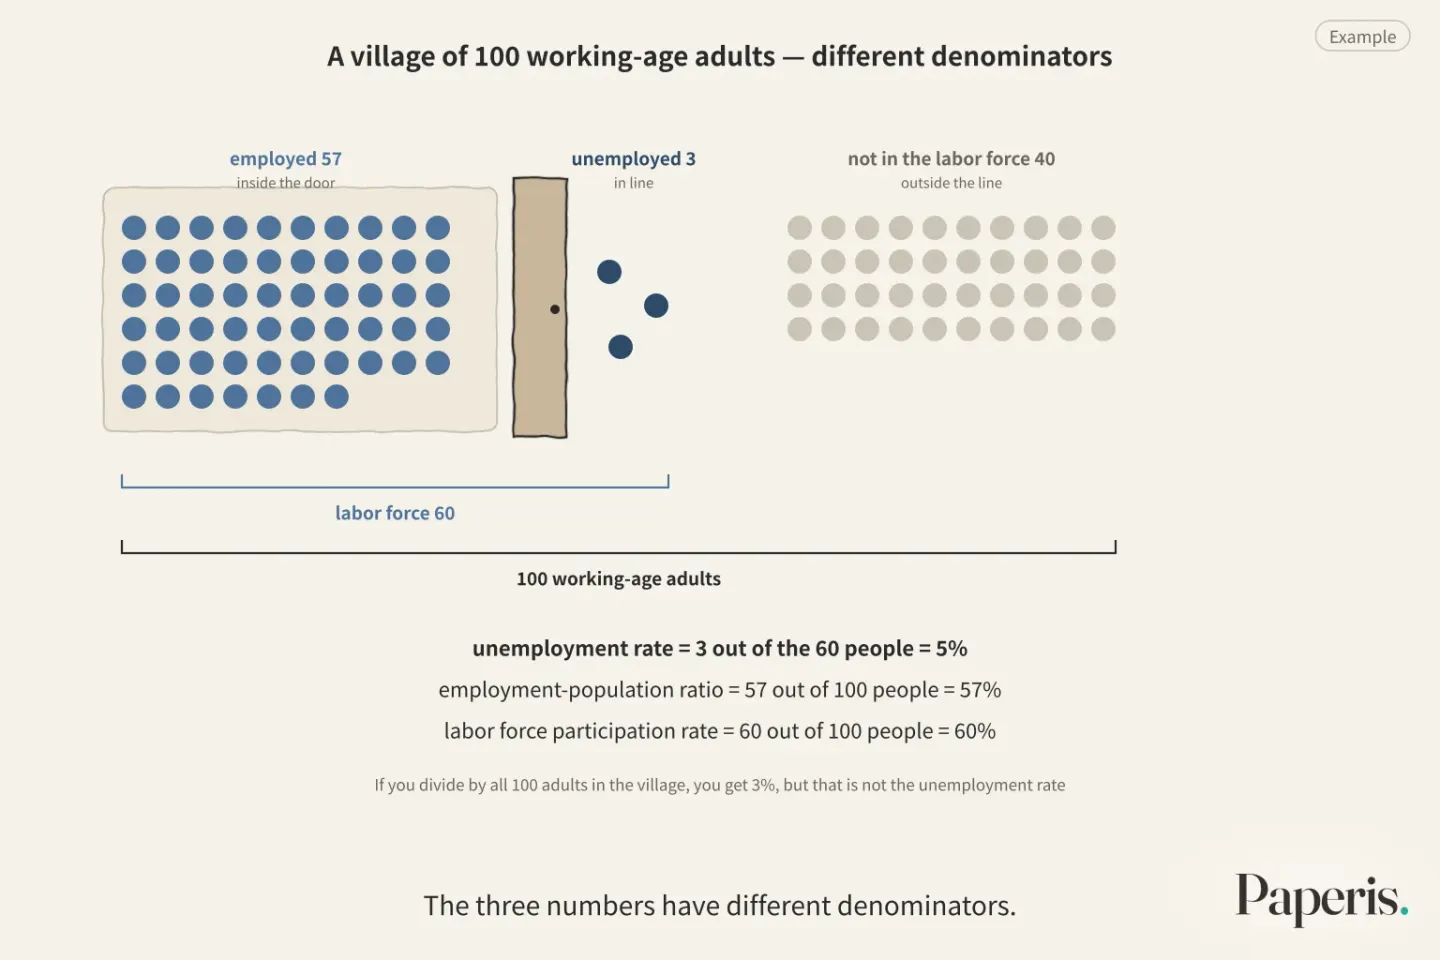
Let us do the math with our example numbers. There is a village where 100 working-age adults live. 57 are working, 3 are looking for work, and 40 are neither working nor looking for work, like students or retirees.
The labor force is 60, which is 57 plus 3. The unemployment rate is 3 out of the 60 people, so it is 5%. If you divide by all 100 adults in the village, you get 3%, but that is not the unemployment rate.
There are two more numbers in this village. The labor force participation rate is the percentage of the working-age population that is in the labor force. Out of 100 people, that is 60, so 60% (OpenStax Principles Macroeconomics 3e 8.1). The employment-population ratio is the percentage of the working-age population that is employed. Out of 100 people, that is 57, so 57%.
The three numbers have different denominators. The unemployment rate is divided by the people inside the door plus those in line, while the labor force participation rate and the employment-population ratio are divided by all adults in the village. When the denominators are different, they move differently even during the same event.
The Person Who Left the Line
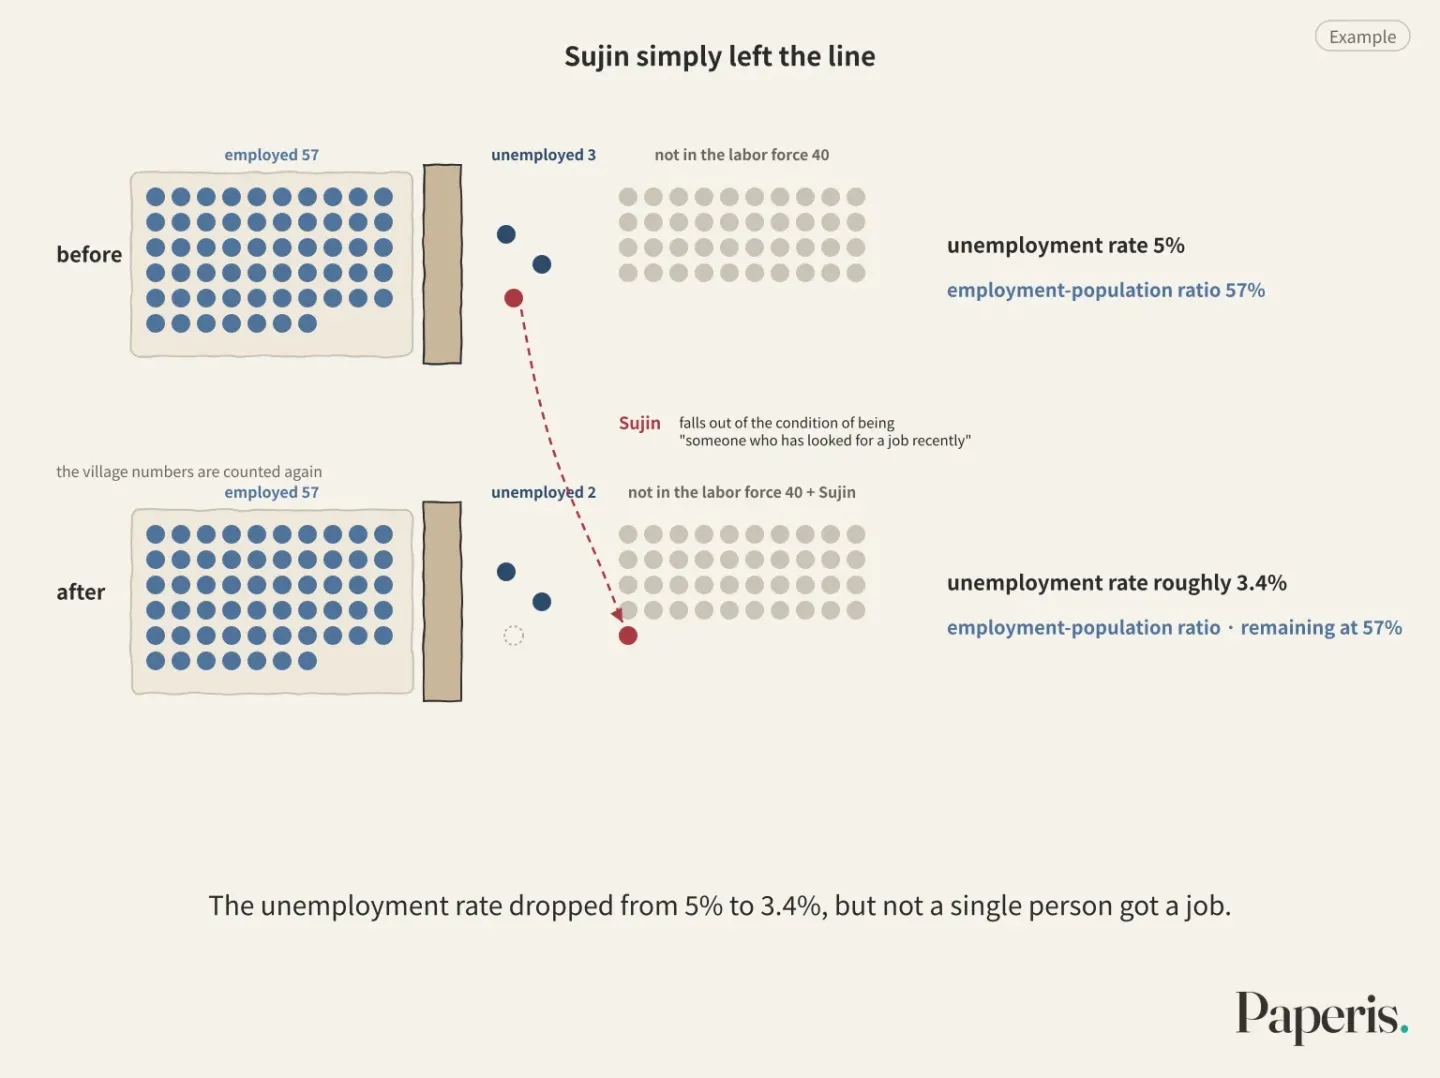
One of the three unemployed people in the village is Sujin, who graduated from college this spring. She submitted resumes for several months after graduating, and during that time, Sujin was an unemployed person standing in line.
When no calls come even after half a year, Sujin stops applying. Her desire to work remains the same, but she judged that there are no positions worth applying for right now. As time passes after her last application, Sujin falls out of the condition of being "someone who has looked for a job recently," and the statistics count Sujin as part of the not-in-the-labor-force population (OpenStax Principles Macroeconomics 3e 8.1). A discouraged worker is someone who wants to work and is able to work, but has stopped looking because they think there will be no suitable jobs.
The village numbers are counted again. The number of people working remains at 57, and the people standing in line have become 2. The labor force is 59 people, and the unemployment rate is 2 out of 59 people, which is roughly 3.4%. The employment-to-population ratio is 57 out of 100 people, remaining at 57%.
The unemployment rate dropped from 5% to 3.4%, but not a single person got a job. Sujin simply left the line, and the fact that the employment rate stayed the same tells us that.
The reasons for leaving the line cannot be bundled into a single one. Discouraged workers are split into multiple groups with different situations. Older workers in poor health, mothers burdened with caregiving, and young unmarried men with short educations are mixed under the same name (Australian household survey data, DOI: 10.1002/ajs4.70099).
Within a single person, the reasons overlap. A qualitative study examining discouraged workers participating in a youth support program in Jeju brought out two streams of difficulties together. One was low self-understanding and confidence with a blurred career direction, and the other was that there were few jobs in the region and it was difficult to access job information. Starting to look again required both mental recovery and concrete job information together (DOI: 10.23108/decrc.2026.8.2.469).
The number of people who stopped looking because of job market conditions fluctuated greatly following the business cycle, but the number of people not looking due to personal reasons like health or housework did not (1981 study, DOI: 10.1177/001979398103500108). Leaving the line cannot be explained entirely by laziness alone, nor by blaming the world alone.
Why We Look at the Employment-to-Population Ratio Together
Things happening outside the line moving the unemployment rate happens on the scale of an entire country, too. There is a working paper suggesting that in the downward trend of the unemployment rate in the U.S. from the early 1980s to the early 2000s, a significant part was played by the change in the proportion of the not-in-the-labor-force population on the fence about whether to work or not shrinking. Because people on the fence usually enter the line by way of being unemployed, when those people decrease, the unemployment rate also drops (DOI: 10.2139/ssrn.2376368).
Another working paper noted that the drop in the unemployment rate during an economic recovery in the early 2000s seemed due to the labor force participation rate falling rather than the employment-to-population ratio rising. The age group where the participation rate dropped the most was teenagers, and about 40% of that decrease was explained by the share of people attending school and changes in the teenage unemployment rate (DOI: 10.2139/ssrn.614084). This means that circumstances outside the job market, such as more people attending school, can also move the participation rate. In the U.S. in 2021, while the unemployment rate was falling, the labor force participation rate remained lower than before COVID-19, causing the two numbers to tell different stories (OpenStax Principles Macroeconomics 3e 8.1).
Looking at the same mechanism in reverse, people who were on the fence usually get in line first when they start looking again (DOI: 10.2139/ssrn.2376368). If such people increase, the unemployment rate might go up.
The unemployment rate shows the length of the line, but it does not show why the line got shorter. The employment-to-population ratio compares the people inside the door to the entire town, so even if people leave the line or return, it does not move by itself. This is why we must look at the unemployment rate and the employment-to-population ratio side by side to read that “the job market situation has improved”.
The “number of employed persons increased by tens of thousands compared to the same month last year” frequently used in Korean news is also read with the same eyes. If the population of working age increases, the number of employed persons increases even if the employment-to-population ratio stays the same, so we look at the employment-to-population ratio alongside the number of employed persons.
Inside the Door but Falling Short
Let us suppose that Sujin has found a ten-hour-a-week part-time job. Sujin wants to work longer, but in the statistics, she is now an employed person inside the door (OpenStax Principles Macroeconomics 3e 8.1).
That is why the difficulty of the job market is sometimes measured more broadly than just through unemployment. That broader picture includes both people who have stopped looking and people working part-time involuntarily (DOI: 10.1023/a:1025686621578).
The expanded unemployment rate is an unemployment index measured by adding to the unemployed those who want to work more but have short working hours, as well as those who intend to work but are left out of the job-seeking criteria. One Korean study counts this broader unemployment by adding to the official unemployed those short-term workers who want to work more, and those who can work or are looking for work but fall outside the official criteria (DOI: 10.15709/hswr.2024.44.1.164). The employment auxiliary indicators appearing in Korean news are also indicators measured more broadly than the official unemployment rate (DOI: 10.23299/bokeri.2020.26.2.002). If the unemployment rate counts only the length of the line, the expanded unemployment rate counts even the people lingering outside the line and those falling short inside the door.
Working fewer hours than desired can also leave a mark on the body and mind. According to a working paper covering the United States, involuntary part-time work appears alongside an increase in psychological distress, depression, and anxiety, and when people get to work as much as they want, that distress appears to reverse. However, the authors noted that more data following people over a long period is needed to confirm whether this is the causal factor (DOI: 10.2139/ssrn.4518458). In a 2022 survey of Korean youth, young people in a broad state of unemployment reported lower self-perceived quality of life, and the authors analyzed that among these connections, the portion passing through depression was the largest (2022 data, DOI: 10.15709/hswr.2024.44.1.164). Because it is data from a single point in time, this survey alone cannot determine which came first.
The numbers change depending on what is included. Indonesia broadened its definition in 2001 to include discouraged workers in the economically active population, and one working paper suggests that this caused the unemployment rate to appear high, masking the post-crisis decrease in unemployment. The author advised that if the broad definition is to continue being used, the International Labour Organization's recommendation to include only discouraged workers who still intend to work should be followed (DOI: 10.2139/ssrn.861464). Changing the definition alters the numbers even for the exact same people.
Unemployment statistics have blind spots because they are numbers that divide people according to preset criteria (OpenStax Principles Macroeconomics 3e 8.1). Regarding South Korea's unemployment rate as well, a critique was published in 2010 pointing out differences from international standards in aspects such as how people who briefly help with family business without pay are treated, and how job-seeking activities are judged (KCI ART001512491). The unemployment rate does not count every single person without a job, but it consistently counts the people lined up according to the preset criteria.
Three Roads Where the Queue Forms
Even in the best of economic years, the queue does not disappear. Unemployment rises when the economy is bad and falls when it is good, but it never drops to zero (OpenStax Principles Macroeconomics 3e 8.2) (OpenStax Principles Macroeconomics 3e 13.1). The reasons why queues form are divided into three categories.
A person who quits their job and spends several weeks looking for a better fit also stands in the queue during that time. Frictional unemployment is unemployment that occurs while workers and open positions look for each other and try to make a match. It takes time to find out whether a pair is a good fit. Because people also use that time to choose a suitable position, frictional unemployment is not purely a bad type of unemployment (OpenStax Principles Macroeconomics 3e 8.4).
Structural unemployment is unemployment that occurs because the skills workplaces are looking for and the skills people possess do not match. This happens when the skills sought by workplaces shift elsewhere for a long time (OpenStax Principles Macroeconomics 3e 8), and because structural unemployment falls under unemployment that remains even when the economy is not bad, a job for someone with those skills does not automatically return just because the economy improves (OpenStax Principles Macroeconomics 3e 8.4).
Cyclical unemployment is unemployment that increases when the economy worsens and decreases when it improves. The job market is also a market where those looking to hire and those looking to work meet (OpenStax Principles Macroeconomics 3e 4.1). Businesses that see the economy cooling down hire fewer people even at the same wage (OpenStax Principles Macroeconomics 3e 8.3). When the positions inside the door decrease, the queue grows longer even if the number of people wanting to work stays the same (OpenStax Principles Macroeconomics 3e 8.3). Most of the unemployment that grows this way is not chosen by the people standing in the queue themselves (OpenStax Principles Macroeconomics 3e 8.3). How the economy rises and falls is covered in detail by "GDP and the Business Cycle — The Last Receipt, and the Day No Receipt Records" in this series.
The natural rate of unemployment is the unemployment rate that remains even when the economy is neither excessively good nor bad. It is the level left behind by frictional unemployment and structural unemployment when cyclical unemployment is zero (OpenStax Principles Macroeconomics 3e 13.1). Although it has "natural" in its name, it is not always the same value, and changes depending on the various conditions of society at that time (OpenStax Principles Macroeconomics 3e 8.4). These three roads are names given to the reasons why the queue forms, and are not terms that point to the character of the people standing in the queue.
The Scars Left by Unemployment
Let us say that Sujin gets the job she wanted after a year. Having stepped out of the line and through the door, her story ends in the unemployment statistics. The story may not end for the person.
The scarring effect is the disadvantage that remains long after a person who has experienced unemployment finds a job again, affecting their income or life satisfaction. This damage to life satisfaction that persists even after re-employment has been repeatedly confirmed in various studies (DOI: 10.1093/sf/soac022).
Let us start with the trace on income. People who experienced a great deal of unemployment between the ages of 18 and 32 had lower incomes and job quality at age 32. This trace was not explained by psychological changes such as self-esteem, and the authors considered it likely that the mechanism lay on the side of the labor market (14-year follow-up study, DOI: 10.29173/cjs23863).
The trace lasts a long time, but it may not be permanent. Swedish youth who graduated from vocational high schools during a recession and experienced unemployment had a higher risk of unemployment up to 5 years later, but the authors judged the effect to be long-lasting yet not permanent (1991–94 graduates, working paper, DOI: 10.2139/ssrn.1790676). In data on British men, the income loss immediately after starting work again was mostly made up for after about 2 years, but the loss proportional to the length of the unemployment period was estimated to remain permanently. That loss was smallest among the young and low-wage workers, and largest among prime-age high-wage workers (1984–94, working paper, DOI: 10.2139/ssrn.271449). In administrative data from Germany as well, the wage loss after unemployment grew with the duration of unemployment, and the reduction of choices left to the unemployed person and moving to lower-paying companies accounted for a large share of that loss (DOI: 10.1108/ijm-02-2021-0065).
There is also a trace on the mind. Symptoms of depression and anxiety were higher during unemployment than among those who were working, and they tended to decrease when people began working again. However, the certainty of the evidence supporting this conclusion was evaluated as low (meta-analysis of 38 follow-up studies, PMID 40930969). In a long-term household panel survey in Germany, unemployment significantly lowered life satisfaction, and that trace remained for at least 5 years after re-employment. The authors saw that trace as driven primarily by recurring spells of unemployment, and concluded that preventing unemployment regardless of its duration benefits an individual's life (DOI: 10.1093/sf/soac022).
There are also cases where the direction is reversed. Because people can lose their jobs due to poor health, the mere co-occurrence of unemployment and poor health does not mean unemployment is the cause. A 1996 review noted that studies teasing out this selection effect were still rare, save for a few health outcomes (PMID 8724235). Programs to reduce depression and anxiety during unemployment generally showed effects, with the evidence being clearest for preventive cognitive therapy and work-related programs, but neither produced consistent effects always, and the risk of bias across the studies was mostly high (PMID 37201898).
The unemployment rate counts the length of the line this month, but the experience of having stood in that line can stay with a person for several years. How to separate the share of that trace coming from unemployment itself from the share coming from original circumstances remains an unsolved question.
Reading News Sentences Again
Now we return to a single sentence from the morning news: "Last month's unemployment rate fell, and the number of employed people increased compared to the same month last year."
The first question is why the line became shorter. If the people standing in the line went inside the door, the employment-to-population ratio would have risen as well; if they left the line, the employment ratio would stay put and the labor force participation rate would have fallen. The second question is the situation inside the door and outside the line. If the expanded unemployment rate fell less than the unemployment rate, it could be a sign that people lingering outside the line or falling short inside the door did not decrease by that much.
Because the unemployment rate comes from a survey asking sampled households, very small rises and falls also mix in the wobbles of the survey. Even so, because a small numerical change represents many people for the entire country (OpenStax Principles Macroeconomics 3e 8.1), we look at a single month's change and the trend over several months together.
The unemployment rate is a number that counts the people standing in the line according to a set standard. It does not count every single person without a job, but knowing what is being counted tells you a great deal. Only when you place the employment-to-population ratio and the labor force participation rate beside it do you finally see even the people outside the line.
Where to Look Next
- The ups and downs of the economy and the numbers that measure them continue from "GDP and the Business Cycle — The Last Receipt, and the Day No Receipt Records" in this series.
- The foundation for the idea that jobs are also a market where buyers and sellers meet lies in "Supply and Demand: Who Sets the Price?".
- How much a number counted through a sample wobbles continues in "How Much Does a Number Counted Once Wobble? — The Two Numbers in the Parentheses, the Confidence Interval".
Source Papers
- "Principles of Macroeconomics 3e — 8.1 How Economists Define and Compute Unemployment Rate" (2022) — OpenStax Principles Macroeconomics 3e 8.1 — How to divide the adult population into employed, unemployed, and out of the labor force; the denominator of the unemployment rate; labor force participation rate; the fact that part-time workers are counted as employed; the U.S. participation rate in 2021; gaps in measurement.
- "Principles of Macroeconomics 3e — Key Concepts and Summary" (2022) — OpenStax Principles Macroeconomics 3e 8 — Conditions for being counted as unemployed; structural unemployment arises when demand shifts away from certain skills for a long time.
- "Principles of Macroeconomics 3e — 8.2 Patterns of Unemployment" (2022) — OpenStax Principles Macroeconomics 3e 8.2 — U.S. unemployment rates rise and fall with the economy but do not drop to zero.
- "Principles of Macroeconomics 3e — 8.3 What Causes Changes in Unemployment over the Short Run" (2022) — OpenStax Principles Macroeconomics 3e 8.3 — Businesses that view the economy as cooling hire less at the same wage, and most unemployed people are involuntary.
- "Principles of Macroeconomics 3e — 8.4 What Causes Changes in Unemployment over the Long Run" (2022) — OpenStax Principles Macroeconomics 3e 8.4 — The natural rate of unemployment is not a fixed value; frictional unemployment is matching time, so it is not entirely bad; definition of structural unemployment.
- "Principles of Macroeconomics 3e — 13.1 The Building Blocks of Neoclassical Analysis" (2022) — OpenStax Principles Macroeconomics 3e 13.1 — Even if cyclical unemployment is zero, frictional and structural unemployment remain, and that level is the natural rate of unemployment.
- "Principles of Macroeconomics 3e — 4.1 Demand and Supply at Work in Labor Markets" (2022) — OpenStax Principles Macroeconomics 3e 4.1 — Labor markets also have demand and supply.
- "Hidden in the Labour Market: An Intersectional Latent Class Analysis of Discouraged Workers in Australia" (2026) — DOI: 10.1002/ajs4.70099 — In an Australian household survey, discouraged workers fall into six groups with different circumstances and cannot be understood as a single group.
- "A Qualitative Study on the Job Search Process of Young Discouraged Workers in Jeju" (2026) — DOI: 10.23108/decrc.2026.8.2.469 — Young discouraged job seekers in Jeju experienced low self-understanding and self-efficacy alongside local labor market constraints and difficulties accessing information; resuming job searches required psychological recovery and concrete information together.
- "Discouraged Workers and Economic Fluctuations" (1981) — DOI: 10.1177/001979398103500108 — The number of people discouraged due to job market conditions fluctuated greatly with the economy, while the number discouraged due to personal reasons did not.
- "Declining Labor Force Attachment and Downward Trends in Unemployment and Participation" (2014) — DOI: 10.2139/ssrn.2376368 — A decrease in the share of the working-age population on the margin was a substantial factor in the decline of the unemployment and participation rates in the U.S. (working paper).
- "Understanding the Decline in the Labor Force Participation of Teenagers" (2004) — DOI: 10.2139/ssrn.614084 — The drop in the unemployment rate during that recovery appears to be the result of a falling participation rate rather than a rising employment-to-population ratio, and about 40% of the decline in teenage participation is explained by changes in school enrollment rates and teenage unemployment (working paper).
- "Underemployment in America: Measurement and Evidence" (2003) — DOI: 10.1023/a:1025686621578 — Underemployment goes beyond unemployment to include people who have given up job hunting, involuntary part-time workers, and the working poor.
- "The Rise and Fall of Underemployment: Implications for Workers' Health" (2023) — DOI: 10.2139/ssrn.4518458 — Involuntary part-time work appears alongside psychological distress, depression, and anxiety, and reverses when leaving it, but causality requires additional longitudinal research (working paper).
- "The Measurement and Trends of Unemployment in Indonesia: The Issue of Discouraged Workers" (2005) — DOI: 10.2139/ssrn.861464 — The relaxation of the definition in 2001 to include discouraged workers in the labor force made the unemployment rate appear higher, masking the post-crisis decline in unemployment, and only discouraged workers willing to work should be included as recommended by the ILO (working paper).
- "Youth Unemployment and Career Scarring: Social-Psychological Mediating Effects?" (2016) — DOI: 10.29173/cjs23863 — Cumulative unemployment between ages 18 and 32 lowers income and job quality at age 32, and labor market mechanisms are far more likely to be the cause than socio-psychological changes such as self-esteem.
- "Scarring Effects of the First Labor Market Experience" (2011) — DOI: 10.2139/ssrn.1790676 — Unemployment immediately after graduation among Swedish vocational high school graduates during the 1991–94 recession increased unemployment risk up to 5 years later, and it is persistent but not permanent (working paper).
- "Unemployment and Subsequent Earnings: Estimating Scarring Among British Men 1984-94" (2001) — DOI: 10.2139/ssrn.271449 — Income losses immediately after re-employment following unemployment mostly recover over 2 years, but the effect of the unemployment duration is permanent, and losses are smallest among the young and low-wage and largest among prime-age and high-wage workers (working paper).
- "Unemployment and its scarring effect on wages in Germany: evidence from linked employer-employee data" (2021) — DOI: 10.1108/ijm-02-2021-0065 — In German administrative data, unemployment produces large and long-lasting wage losses depending on its duration, and selection into lower-paying firms accounts for a large share of that.
- "Mental health effects of unemployment and re-employment: a systematic review and meta-analysis of longitudinal studies." (2025) — PMID 40930969 — Across 38 follow-up studies, unemployed individuals had high symptoms of depression, anxiety, and psychological distress, which decreased after re-employment, though the certainty of evidence is low.
- "Subjective Well-Being Scarring Through Unemployment: New Evidence from a Long-Running Panel" (2022) — DOI: 10.1093/sf/soac022 — In a German panel, unemployment significantly lowers life satisfaction, leaves traces for at least 5 years after re-employment, and repeated unemployment drives this. The authors conclude that preventing unemployment is beneficial regardless of duration.
- "Health and unemployment." (1996) — PMID 8724235 — Poor health can also lead to job loss, and studies controlling for this selection effect are still rare except for some health outcomes.
- "Mental health and unemployment: A systematic review and meta-analysis of interventions to improve depression and anxiety outcomes." (2023) — PMID 37201898 — Mental health interventions for the unemployed were generally effective, with cognitive therapy and work-related interventions showing the clearest evidence, though the risk of bias among the studies was generally high.
- "경제활동인구조사의 분산추정방법 검토" (2008) — KCI ART001318450 — The Economically Active Population Survey is a complex sample design survey that has partially replaced its sample every month since 2005 and repeatedly surveys sampled households for 3 years.
- "실업률 측정의 문제점과 보완적 실업지표 연구" (2010) — KCI ART001512491 — The Korean unemployment rate differs from ILO standards in its treatment of unpaid family workers working less than 18 hours and job-search requirements, and proposes expanded unemployment indicators encompassing potential unemployment and underemployment.
- "청년의 확장실업이 소득, 사회자본, 우울을 매개하여 주관적 웰빙에 미치는 영향" (2024) — DOI: 10.15709/hswr.2024.44.1.164 — In the 2022 Youth Life Status Survey, expanded unemployment—combining time-related underemployed workers, official unemployed people, potentially employable people, and potential job seekers—lowered subjective well-being through income, social capital, and depression, with the depression pathway being the largest.
- "고용보조지표를 활용한 청년실업과 경기상관 분석" (2020) — DOI: 10.23299/bokeri.2020.26.2.002 — Expanded youth employment subsidiary indicators including the potential economically active population show a long-term upward trend, making it difficult to interpret the rise in youth unemployment solely through economic cyclical factors.
Sources (25)
- Principles of Macroeconomics 3e — 8.1 How Economists Define and Compute Unemployment Rate
- Principles of Macroeconomics 3e — Key Concepts and Summary
- Principles of Macroeconomics 3e — 8.2 Patterns of Unemployment
- Principles of Macroeconomics 3e — 8.3 What Causes Changes in Unemployment over the Short Run
- Principles of Macroeconomics 3e — 8.4 What Causes Changes in Unemployment over the Long Run
- Principles of Macroeconomics 3e — 13.1 The Building Blocks of Neoclassical Analysis
- Principles of Macroeconomics 3e — 4.1 Demand and Supply at Work in Labor Markets
- Hidden in the Labour Market: An Intersectional Latent Class Analysis of Discouraged Workers in AustraliaDOI 10.1002/ajs4.70099
- A Qualitative Study on the Job Search Process of Young Discouraged Workers in JejuDOI 10.23108/decrc.2026.8.2.469
- Discouraged Workers and Economic FluctuationsDOI 10.1177/001979398103500108
- Declining Labor Force Attachment and Downward Trends in Unemployment and ParticipationDOI 10.2139/ssrn.2376368
- Understanding the Decline in the Labor Force Participation of TeenagersDOI 10.2139/ssrn.614084
- Underemployment in America: Measurement and EvidenceDOI 10.1023/a:1025686621578
- The Rise and Fall of Underemployment: Implications for Workers' HealthDOI 10.2139/ssrn.4518458
- The Measurement and Trends of Unemployment in Indonesia: The Issue of Discouraged WorkersDOI 10.2139/ssrn.861464
- Youth Unemployment and Career Scarring: Social-Psychological Mediating Effects?DOI 10.29173/cjs23863
- Scarring Effects of the First Labor Market ExperienceDOI 10.2139/ssrn.1790676
- Unemployment and Subsequent Earnings: Estimating Scarring Among British Men 1984-94DOI 10.2139/ssrn.271449
- Unemployment and its scarring effect on wages in Germany: evidence from linked employer-employee dataDOI 10.1108/ijm-02-2021-0065
- Mental health effects of unemployment and re-employment: a systematic review and meta-analysis of longitudinal studiesPMID 40930969
- Subjective Well-Being Scarring Through Unemployment: New Evidence from a Long-Running PanelDOI 10.1093/sf/soac022
- Health and unemploymentPMID 8724235
- Mental health and unemployment: A systematic review and meta-analysis of interventions to improve depression and anxiety outcomesPMID 37201898
- 청년의 확장실업이 소득, 사회자본, 우울을 매개하여 주관적 웰빙에 미치는 영향DOI 10.15709/hswr.2024.44.1.164
- 고용보조지표를 활용한 청년실업과 경기상관 분석DOI 10.23299/bokeri.2020.26.2.002