
Paperis Articles
Risk and Diversification — The Mother Who Counted Her Umbrella Seller and Straw-Shoe Seller Together
The most common yardstick of risk in finance is how widely outcomes swing, in either direction. Mixing things that do not move together reduces the swing, but the part that shakes the whole market remains, and studies in several countries find investors diversify less than theory expects.
Your field's papers, as audio
Pick your fields and journals — Paperis summarizes the key papers and turns them into audio. Listen on your commute.
Start Paperis free →Risk and Diversification — The Mother Who Counted Her Umbrella Seller and Straw-Shoe Seller Together
A Mother with Two Sons
We begin by slightly modifying an old story. A mother had two sons. Her older son sold umbrellas, and her younger son sold straw shoes. On rainy days, the mother worried about her younger son because his straw shoes wouldn't sell, and on sunny days, she worried about her older son because his umbrellas wouldn't sell.
A neighbor told her to change how she counted. When it rained, the older son did well, and when the sun came out, the smaller son did well. If the earnings of the two sons are counted together as the earnings of a single household, one side always has business regardless of the weather.
This calculation contains two investment ideas. One is the fact that the earnings of a single shop fluctuate wildly from day to day, and the other is the fact that combining two fluctuating earnings makes them less erratic. There is a year that even this calculation cannot stop. In a year when an epidemic strikes and the market fails to open altogether, both sons come up empty-handed.
This article follows the arithmetic of this household to untangle the volatility and dividing-up of investments. The examples in this article are drawn from the deposits, stocks, and funds commonly seen by Korean readers and from Korean data, while the concepts apply in any country.
A Scale to Measure the Swings
Let us say you put 10 million won into a stock, and a year later it became 11 million won. The following year, that 11 million won became 9.9 million won. The first year grew by 10%, and the second year shrank by 10%.
The rate of return is the value that shows by what percentage the money you deposited or invested increased or decreased over a certain period. The rate of return on a stock is not the same every year. A share is simply that piece made by cutting a company up into equal, tiny slices. Every time good or new bad news happens to a company, the guess about the money that company will earn and spend in the future changes, and the stock price moves along with it (OpenStax Principles Finance 2e 15.1).
In finance, risk is the degree to which future returns cannot be known—in other words, how much the outcome swings. Finance views that uncertainty of how returns will turn out, and the width by which returns bounce up and down every year, as risk (OpenStax Principles Finance 2e 15.1). In everyday life, the word "risky" is used to mean that you might get hurt. Financial risk is broader than that, and even the possibility of turning out better than expected is included within that uncertainty.
Volatility is a value showing how wildly a stock price bounces up and down. The most common scale used to measure volatility in finance is the standard deviation (OpenStax Principles Finance 2e 15.1). Standard deviation is a value that measures how far apart each year's returns are scattered from their average. The value is small when the values crowd close to the average and large when they are spread far apart, and it never gets smaller than 0 (OpenStax Principles Finance 2e 13.2). Therefore, the risk measured by standard deviation is the span of deviation from the average, whether upward or downward, and a year that earns much more than hoped is counted as a swing just like a year that loses a lot. Some choose not to use just this single yardstick. One Korean study put forward an indicator that measures risk by dividing it into the side that deviates below the average and the side that deviates above, and saw that an indicator going beyond the standard of looking only at the average and the swings is needed (DOI: 10.22510/kjofm.2020.37.4.002).
A normal distribution is a shape where most values cluster near the average, and as you get farther from the average, they rapidly become rare. If we assume that returns follow this bell shape, out of about three years, in roughly two of them the return falls between one standard deviation above and below the average (OpenStax Principles Finance 2e 15.1). For example, for an investment where the average of annual returns is 8% and the standard deviation is 20%, out of three years, in roughly two of them it falls between −12% and 28%. The larger the standard deviation, the farther a single year's result can fall from the average, and finance considers that much more risky.
The bell shape is an approximation. Even a textbook dealing with the history of U.S. stocks notes that returns follow the bell shape "roughly" (OpenStax Principles Finance 2e 12.4). In the same Korean study, about 80% of the returns of stocks in the securities market did not fit the assumption that they followed a normal distribution in statistical testing (DOI: 10.22510/kjofm.2020.37.4.002). Behind the single number called "annual return" lies this kind of span.
Asking for a Larger Share in Exchange for More Turbulence
Let us consider an investment that, with a 50-50 chance, either rises by 30% or falls by 10% a year (example). When you weigh both cases evenly, the share you can hope for from this investment is 10% per year. Yet the actual outcome does not turn out to be 10% in either year. It is either 30% or −10%.
The expected return is the average return you hope for when you weigh all the things that could happen in the future. The expected return is merely the share you hope for on average, and it does not guarantee the share you will actually receive that year.
Regarding whether you can hope for a larger share if you take on more turbulence, a 1964 theoretical paper viewed it this way. When the market is in equilibrium and you compare well-diversified portfolios, a higher expected return can be achieved only by taking on more risk, and the extra return you hope for for every additional unit of risk is the price of risk (DOI: 10.1111/j.1540-6261.1964.tb02865.x). The risk premium is the share of extra return you hope for in exchange for taking on more turbulence.
From 1981 to 2020, the average return of U.S. stocks was higher than that of government bonds, corporate bonds, and short-term financial instruments. Over a longer U.S. record, a portfolio of small-cap stocks had both a higher average return and greater turbulence than a portfolio of large-cap stocks. The magnitude of that difference varied by period; the margin by which the annualized compound return of U.S. small-cap stocks exceeded large-cap stocks was 1.76 percentage points from 1926 to 2019, and 0.31 percentage points from 1980 to 2020. The two periods also used different comparison indexes (OpenStax Principles Finance 2e 12.4).
The historical record that those who took on more turbulence earned more in the past is no guarantee that they will earn that much more in the next period. The risk premium is the share hoped for by someone who took on turbulence, and the very statement that turbulence is large already implies that years may come when that share is not received.
Rainy Years and Clear Years
Let us return to the homes of the two sons. This time, suppose that 10 million won was entrusted half-and-half to an umbrella shop and a straw-sandal shop (example). In a rainy year, the umbrella shop makes 20% and the straw-sandal shop loses 10%. In a clear year, it is the reverse. If rainy years and clear years are split fifty-fifty, each shop averages a 5% annual gain while swinging between 20% and −10% each year.
The arithmetic for the house that splits its money fifty-fifty is different. In a rainy year, the 5 million won on the umbrella side becomes 6 million won, and the 5 million won on the straw-sandal side becomes 4.5 million won. Combined, that is 10.5 million won, a 5% return. In a clear year, the same calculation yields 10.5 million won. The average return remains 5%, but because the two shops move in exact opposition, the year-to-year volatility disappears.
A portfolio is a collection of multiple investment assets held by a single person. Diversification is the practice of spreading money across multiple investment assets rather than concentrating it in one place. When you hold shares in multiple companies, the fortunes of a single company do not dictate the entire bundle, and diversification is the method of managing risk in this way (OpenStax Principles Finance 2e 15.2).
The reason the fluctuations of the two shops cancelled each other out is that the two moved in exact opposition. Correlation is a relationship showing how closely two values move together, and the correlation coefficient expresses its strength and direction as a number between −1 and +1. +1 means they always move in the same direction by the same proportion, while −1 means they always move in exact opposite directions (OpenStax Principles Finance 2e 15.2). When there is no relationship where one changes and the other follows in a straight line, they are said to be uncorrelated (OpenStax Principles Finance 2e 14.1). The umbrella shop and the straw-sandal shop are a pair with a correlation coefficient of −1.
In pairs where the correlation coefficient is not −1, the volatility is only partially reduced. For example, if you allocate equal halves to two investment assets that each have a standard deviation of 20%, the standard deviation of the portfolio is 20% when the correlation coefficient is +1, about 17% when it is 0.5, about 14% when it is 0, and 0% when it is −1. This calculation followed the formula for finding the standard deviation of a portfolio using the standard deviations of the two assets and their correlation coefficient (DOI: 10.1111/j.1540-6261.1964.tb02865.x). Mixing things that do not move in identical directions reduces portfolio volatility, and the lower the degree to which they move together, the more it is reduced (OpenStax Principles Finance 2e 15.2).
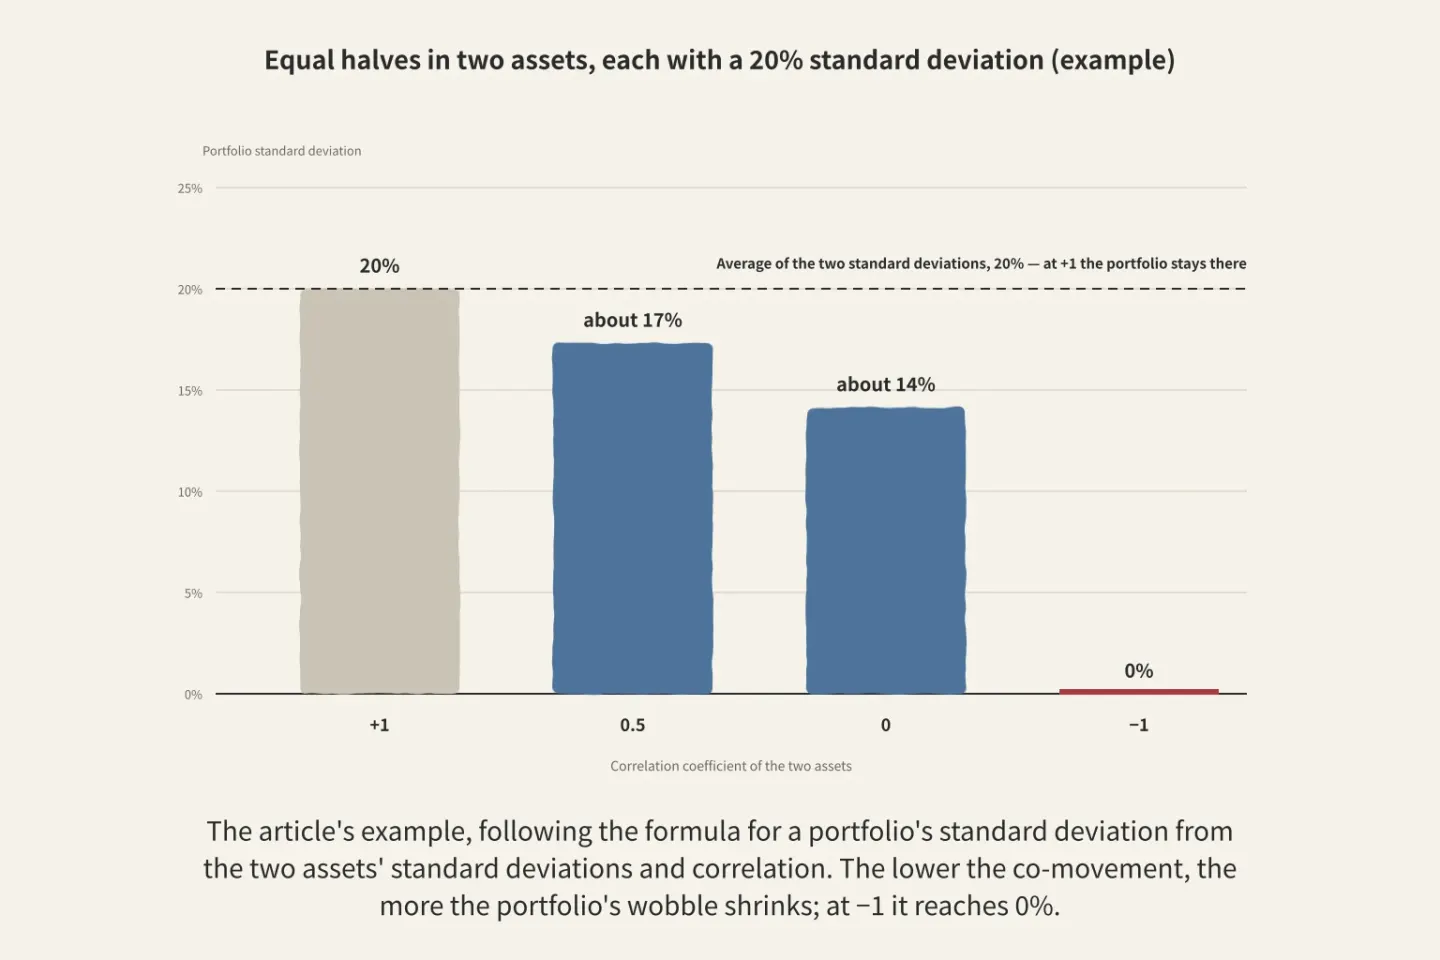
Figure: a diagram Paperis drew using only what the article says
Real-world pairs do not usually move in as exact opposition as umbrellas and straw sandals. The South Korean stock market and the stock markets of major Asian countries have also mostly moved closely together (DOI: 10.35527/kfedoi.2009.8.3.001).
The average return of a diversified portfolio is the weighted average of the returns of the included assets, based on their proportions. Volatility is not averaged in that way. When you mix things that do not move in identical directions, the standard deviation of the portfolio becomes smaller than the average of their individual standard deviations, and can even become smaller than the standard deviation of any single asset included (OpenStax Principles Finance 2e 15.5; DOI: 10.1111/j.1540-6261.1964.tb02865.x). When you diversify, the expected return becomes the average of the assets, and the volatility becomes smaller than that average, provided the assets do not move in identical directions. There is also something you give up. The return of the portfolio is lower than the return of the single best-performing asset it contains, meaning you miss out on the share you would have gotten if you had bet solely on that one. This is the flip side of the same calculation as avoiding the share you would have lost if you had bet solely on the worst-performing one.
A Year Without a Market
Let us imagine a year when an epidemic strikes and the local market cannot open. Whether it rains or the sun shines, people do not come to the market, so neither umbrellas nor straw sandals are sold. The year the eldest son falls sick alone is different. Only the umbrella shop closes its doors, while the straw-sandal shop stays open just as before.
Unsystematic risk is the wobble that comes from events hitting just one company, and it shrinks when you spread your holdings across many places. An example is that company getting sued, and in our old story, the year the eldest son falls sick alone (OpenStax Principles Finance 2e 15.2). Systemic risk is the wobble that comes from events shaking the entire market together, and it does not vanish no matter how much you spread your holdings. Examples are things that reach the whole market like a shift in interest rates or a global pandemic, and in our old story, the year the market cannot open (OpenStax Principles Finance 2e 15.2).
Let us suppose a mother has a third son and that son also sells umbrellas. Even if there are three shops, the worry in a year with no rain stays the same. Companies in the same industry go through the same situations together and move strongly together, so adding more such companies reduces the wobble only a little (OpenStax Principles Finance 2e 15.2).
Let us follow in numbers what happens when you increase the number of stocks. For example, within one country's market, let us suppose a single stock's wobble is made of a market share that all stocks experience equally (a standard deviation of 15%) and a share coming only from that company (a standard deviation of 30%) (example). We set these two shares to move separately from each other, and the company-specific shares to not move together with one another either. Wobbles that move separately do not simply add up, so if you hold just one stock, the standard deviation is not 45% by adding 15% and 30%, but about 34%. If you divide your holdings equally among 10 such stocks, it becomes about 18%, for 30 stocks about 16%, and for 100 stocks about 15%. The share coming only from the company shrinks as you divide further, and the 15% market share remains no matter how much you increase the stocks.
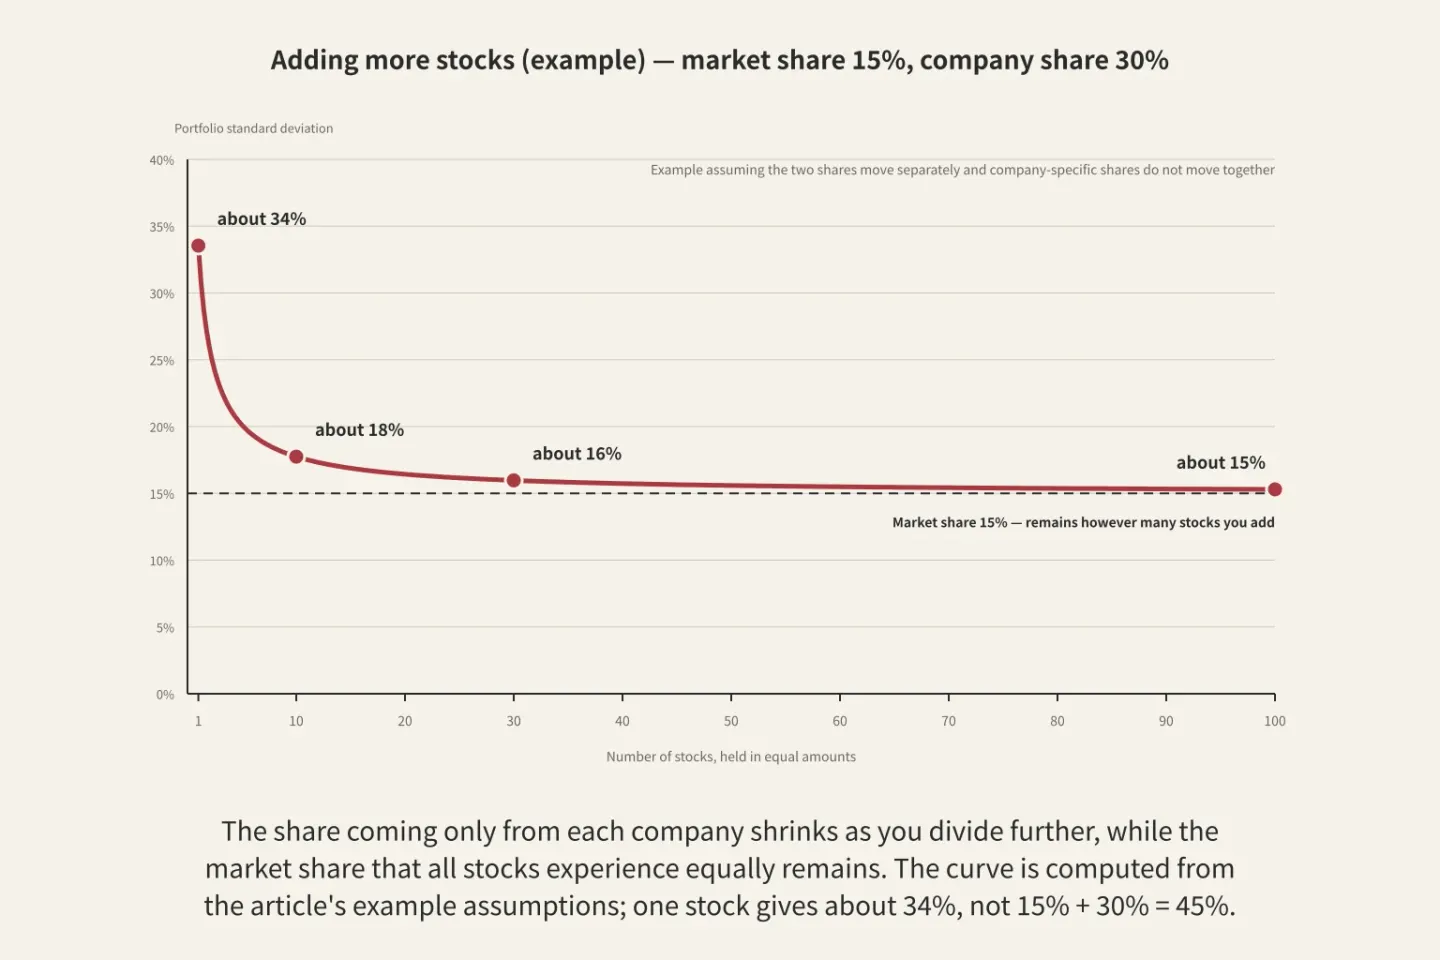
Figure: a diagram Paperis drew using only what the article says
In a study introduced by a textbook, the standard deviation of a portfolio shrank fastest when stocks increased from 1 to 2 or 3, and as stocks increased, the share reduced by adding one more grew smaller (OpenStax Principles Finance 2e 15.2). In Korean stock data, the standard deviation when holding just one stock was 25.7%, and it was calculated that dividing holdings across 20 stocks could eliminate 90.9% of the wobble that can be reduced through diversification (monthly data from 1994 to 2013, KCI ART002280807). Some of the wobble that remains even when you include an entire country's market shrinks further if you expand to the world. In the same study, portfolios expanded to world stocks reduced the wobble that could not be diversified away within Korea by an additional 3.8 percentage points in standard deviation, and as the undiversifiable wobble of the Korean market has shrunk, the effect gained by expanding outside the country has also grown smaller (KCI ART002280807). There is no number everyone agrees on for how many stocks are enough, and the very phrase "well-diversified portfolio" is a relative concept (OpenStax Principles Finance 2e 15.2).
This distinction also connects to the risk premium. The earlier 1964 theoretical paper viewed that because there is a share you can avoid by diversifying, an asset's total wobble does not determine its value. In the same paper, there could be no consistent relationship between the total wobble of individual assets and their expected return, and the author concluded that only how much an asset moves along with the movement of the overall economy is the share to be counted as risk (DOI: 10.1111/j.1540-6261.1964.tb02865.x). According to this theory, even if you carry wobble that can be reduced by diversifying, no extra share you might hope for is attached as a reward, and textbooks also write that there is no reward for company-specific risk, while there is a reward for systemic risk (OpenStax Principles Finance 2e 15.5).
The degree of moving together also changes depending on the times. The synchronization between the Korean stock market and the markets of major Asian countries deepened after the foreign exchange crisis in the late 1990s. Still, portfolios mixing several Asian markets that moved less in tandem yielded a slightly higher return per unit of wobble than cases invested only in the Korean market (DOI: 10.35527/kfedoi.2009.8.3.001). When you diversify, the wobble coming from a single company's accident shrinks, but the share that shakes the whole market remains.
Splitting the Big Streams
There is a decision that comes before dividing your money among individual stocks. It is how much of the money you have to keep in stocks, and how much to put in places that hardly budge like savings accounts, or in bonds.
Asset allocation is the process of deciding how much of your money to divide among big categories with different natures, such as stocks, bonds, and savings. Textbooks note that because stocks have earned more than bonds over the long record of the U.S. capital market, many investment advisors have emphasized asset allocation over picking individual stocks (OpenStax Principles Finance 2e 12.4). That emphasis relies on past U.S. records.
In theory, too, investment choices are divided into two steps. Under certain conditions, you can solve this by first picking the best bundle of fluctuating assets, and then deciding how much money to split between that bundle and non-fluctuating assets (DOI: 10.1111/j.1540-6261.1964.tb02865.x). Which side you place more weight on in the second step depends on how much that person dislikes fluctuation (DOI: 10.1111/j.1540-6261.1964.tb02865.x). In terms of an old story, it is the job of separating the money to entrust to two different shops from the money to place where a set interest is received.
People Who Diversify Less Than You'd Think
Shareholders of a local telephone company often lived in the area the company served, and customers held that company's stock more often than other regional companies. The author saw this bias as cut from the same cloth as households tending to concentrate their stocks in a few places, employees putting their own company stock in their retirement accounts, and home bias between countries, concluding that people invest in what is familiar and frequently overlook the principle of diversification (DOI: 10.1093/rfs/14.3.659).
Home bias is a phenomenon where investors hold a much larger share of their own country's assets than theory would guess. A review article covered this phenomenon in equities (DOI: 10.1257/jel.37.2.571). A working paper (1995) noted that even in advanced countries with well-connected financial markets, investors held almost exclusively domestic assets, and analyzed that labor income already moved in tandem with domestic stocks. In the best portfolio calculated by that model, the share of domestic stocks was likely to come out less than zero (DOI: 10.3386/w5019). Translated into an old tale, it is like a household whose eldest son's earnings already depend on the rain betting its remaining money on an umbrella shop. The data measuring the extent of home bias among South Korean retail investors are not among the sources gathered here.
Concentrating investments in just a few stocks is also common. The stock portfolios of US retail investors were generally poorly diversified, and the degree of under-diversification was greater the younger the investors were, and the lower their income and education levels were. In the same study, there was little evidence that portfolio size or trading costs prevented diversification, and while holding undiversified portfolios was harmful to most investors, a subset with better-than-average information diversified less because of that information (DOI: 10.1093/rof/rfn005). Data on customers of a German brokerage showed that the more people reported being comfortable with risk, the less they diversified and the more frequently they traded (DOI: 10.1007/s10679-005-4997-z). A survey of Portuguese retail investors found that higher education levels and financial literacy correlated with more diversified portfolios (DOI: 10.1080/14697680902878105).
Even when people do diversify, the method they use is sometimes simple. Naïve diversification is an approach where money is divided equally across the number of available options. In employer-sponsored retirement plans where companies provided a list of selectable funds, some participants split their money equally among the number of funds on the list, making the share allocated to equities heavily dependent on how many equity funds happened to be on the list (DOI: 10.1257/aer.91.1.79).
Studies have also examined the reasons behind under-diversification. Stocks in household accounts concentrated in a few stocks performed better than those of households with more diversified holdings (especially in households with larger accounts), and the difference was greater for stocks not included in the US large-cap S&P 500 index and for geographically close stocks. The author wrote that this can be seen as the result of successfully capitalizing on information advantages (DOI: 10.1017/s0022109000004233). Another study using 60,000 retail investor accounts found that the returns of under-diversified investors leaned more toward the possibility of large wins, and interpreted that these investors traded away some efficiency relative to volatility to buy into that possibility (DOI: 10.1093/revfin/hhm011). A paper reviewing household finance observed that many households generally invest effectively, while those making major mistakes are a minority concentrated among the poorer and less educated (DOI: 10.1111/j.1540-6261.2006.00883.x).
Across studies from multiple countries, investors diversified less than theory would guess, and the reasons blend familiarity, risk tolerance, knowledge and information, and the desire for the possibility of striking it big.
Again, Before the Mother of Two Sons
The younger son's straw shoe shop softens the fluctuations that come from the weather and the losses in the year the older son fell ill in bed alone, but it does not erase the losses in a year when the market does not open due to an epidemic. Those losses are the share that shakes the entire market.
The metaphor of the old story has limits. The rain in the old story moves the two shops in exact opposite directions, but real investment targets usually move in the same direction to some degree, and that degree also changes from time to time. The calculation of the old story assumed the average earnings of the two shops were equal, but in reality, the side with greater fluctuations can have a more desired share, and that share is not fixed.
That is why, next to the number for the "annual return" of a product whose price goes up and down like a fund, two more questions can be placed and read: how much that number fluctuated each past year, and how much it moves together with other things you already own.
Where to Look Next
What a single share of stock means is untangled in "What You Actually Own When You Own a Share — And Where You Stand in Line". Shifts in interest rates that shake the entire market are covered in "Interest Rates and Central Banks — A Brake in the Engine Room, a Train That Slows Long After", and large drops that a bell curve cannot anticipate along with moments when the whole market shakes at once continue in "Why Financial Crises Keep Coming Back — Fat Tails, Black Swans, and Systemic Risk". The debate surrounding whether informed investors can earn more than others is handled by "Can You Beat the Market? — The Cracks in the Efficient Market Hypothesis". The perspective of what you put down when dividing up assets begins in "Scarcity and Opportunity Cost: What Do You Give Up When You Choose?".
Other parts of this series also connect with this piece. "Compound Interest — A Snowball That Grows as It Rolls, and the Share That Melts Along the Way" untangles how returns accumulate over time, "Bonds — Why Does a Bundle of Dated Vouchers Rise and Fall in Price?" explores what bonds—a branch of asset allocation—are and how they fluctuate, and "Funds and Index Funds — The Ship That Sails With the Fleet, the Ship That Tries to Outrun It, and the Fare Paid Every Year" explains how funds holding multiple stocks in a bundle are structured.
Source Papers
- "Principles of Finance 2e — 15.1 Risk and Return to an Individual Asset" (2026) — OpenStax Principles Finance 2e 15.1 — Return is the gain desired from an investment, and uncertainty alongside year-to-year fluctuation is viewed as risk. Fluctuation is measured by standard deviation, and if shaped like a bell curve, two out of three years fall within the mean ± 1 standard deviation. Company news changes estimates of future revenues and costs, shaking share prices.
- "Principles of Finance 2e — 15.2 Risk and Return to Multiple Assets" (2026) — OpenStax Principles Finance 2e 15.2 — Diversification across multiple stocks is a risk management tool. Mixing assets that do not have a perfect positive correlation reduces risk (stocks in the same industry have high correlations and thus reduce risk only slightly). Company-specific risk (unsystematic) is reduced by diversification, but market-wide risk (systematic) remains, and there is no consensus on how many stocks are enough.
- "Principles of Finance 2e — 13.2 Measures of Spread" (2026) — OpenStax Principles Finance 2e 13.2 — Standard deviation is a measure of how far values are scattered from the mean and is zero or greater; it is small when values are clustered and large when they are dispersed.
- "Principles of Finance 2e — 14.1 Correlation Analysis" (2026) — OpenStax Principles Finance 2e 14.1 — Correlation is a measure of the association between two numerical variables, where a positive correlation moves in the same direction, a negative correlation moves in opposite directions, and no relationship means no correlation.
- "Principles of Finance 2e — 12.4 Historical Picture of Returns to Stocks" (2026) — OpenStax Principles Finance 2e 12.4 — US stock returns are roughly bell-shaped. From 1981 to 2020, US stocks earned more than bonds and short-term financial instruments, leading many advisors to emphasize asset allocation first. The small-firm premium was much smaller from 1980 to 2020 than from 1926 to 2019.
- "Principles of Finance 2e — 15.5 Using Excel to Make Investment Decisions" (2026) — OpenStax Principles Finance 2e 15.5 — The standard deviation of a portfolio differs from the average standard deviation of its individual stocks, and because correlations are not perfectly positive, it can be smaller than that of any single stock.
- "CAPITAL ASSET PRICES: A THEORY OF MARKET EQUILIBRIUM UNDER CONDITIONS OF RISK" (1964) — DOI: 10.1111/j.1540-6261.1964.tb02865.x — Theoretical paper: In equilibrium, higher expected returns are obtained only by taking on more risk. Investment choice is split between selecting a bundle of risky assets and allocating between it and a risk-free asset. When correlations are not perfect, the portfolio standard deviation falls (correlations typically range from 0 to +1). Risk that can be avoided through diversification is irrelevant to price, and only responses to economic activity count as risk.
- "한국 투자자 관점에서의 국제주식투자 위험분산효과" (2016) — KCI ART002280807 — Monthly data from 51 countries for 1994–2013: In Korea, the standard deviation of a single stock was 25.7%, and 20 stocks diversified away 90.9% of diversifiable risk. Expanding to a global portfolio reduced undiversifiable risk by an additional 3.8 percentage points, while the undiversifiable risk of the Korean market and the benefits of international investment have both been decreasing.
- "하방위험을 고려한 포트폴리오 성과 평가" (2020) — DOI: 10.22510/kjofm.2020.37.4.002 — Roughly 80% of KOSPI-listed stocks rejected normality tests, and the paper proposed performance metrics that separate downside and upside risk.
- "시간가변 상관관계를 이용한 아시아 주식시장간의 동조화와 분산투자효과에 대한 연구" (2009) — DOI: 10.35527/kfedoi.2009.8.3.001 — The synchronization of Korean and major Asian markets intensified after the foreign exchange crisis, but an optimal portfolio including less-synchronized Asian markets achieved a higher Sharpe ratio (0.134) than Korea alone (0.118), demonstrating diversification benefits.
- "Familiarity Breeds Investment" (2001) — DOI: 10.1093/rfs/14.3.659 — Shareholders of US regional telephone companies tend to live in their service areas and are customers of those companies. This bias matches household portfolio concentration, company stock ownership, and domestic bias. People invest in familiar places and frequently ignore portfolio theory.
- "Trying to Explain Home Bias in Equities and Consumption" (1999) — DOI: 10.1257/jel.37.2.571 — Review paper: Investors hold a much larger share of domestic assets in their portfolios than standard portfolio theory estimates (equity home bias).
- "The International Diversification Puzzle is Worse Than You Think" (1995) — DOI: 10.3386/w5019 — Working paper: Even in well-integrated developed markets, investors hold almost exclusively domestic assets. Because human capital returns are highly correlated with domestic financial assets, the optimal portfolio is likely a short position in domestic stocks.
- "Equity Portfolio Diversification" (2008) — DOI: 10.1093/rof/rfn005 — US individual investors are underdiversified, a tendency that worsens among younger, lower-income, and less-educated individuals. There is little evidence that portfolio size or transaction costs prevent diversification. Underdiversification is costly for most, but a small minority underdiversify due to superior information.
- "Talk and Action: What Individual Investors Say and What They Do" (2005) — DOI: 10.1007/s10679-005-4997-z — Survey and trading records of German brokerage clients: Self-reported risk aversion is the most important determinant of diversification and portfolio turnover. Investors who claim to tolerate more risk underdiversify and trade more frequently.
- "Financial literacy and portfolio diversification" (2009) — DOI: 10.1080/14697680902878105 — Survey of Portuguese retail investors: Educational attainment and financial literacy have a positive effect on portfolio diversification.
- "Naive Diversification Strategies in Defined Contribution Saving Plans" (2001) — DOI: 10.1257/aer.91.1.79 — In defined-contribution retirement plans, some investors follow a 1/n strategy, dividing contributions equally across the offered number of funds, and stock allocations are heavily influenced by the proportion of equity funds on the menu.
- "Portfolio Concentration and the Performance of Individual Investors" (2008) — DOI: 10.1017/s0022109000004233 — Households that concentrated their brokerage accounts in a few stocks outperformed more diversified households. This effect was stronger for stocks outside the S&P 500 and local stocks, which may be the result of exploiting information asymmetries.
- "Equilibrium Underdiversification and the Preference for Skewness" (2007) — DOI: 10.1093/revfin/hhm011 — 60,000 retail investor accounts: The returns of underdiversified investors exhibit high positive skewness, and their mean-variance inefficiency is largely explained by sacrificing efficiency to obtain high skewness.
- "Household Finance" (2006) — DOI: 10.1111/j.1540-6261.2006.00883.x — Evidence on participation, diversification, and refinancing shows that many households invest effectively while a minority make major mistakes, and that minority tends to be poorer and less educated.
🏛️ Landmark papers behind this article
Source papers that made it into 'Shoulders of Giants' — the foundational works. Now that you have the concept, go to the origin.
↳ Linked via 2004 reinterpretation
Developed the Capital Asset Pricing Model (CAPM) to determine the expected return of an asset based on its systematic risk.
More in this field →
Sources (19)
- Principles of Finance 2e — 15.1 Risk and Return to an Individual Asset
- Principles of Finance 2e — 15.2 Risk and Return to Multiple Assets
- Principles of Finance 2e — 13.2 Measures of Spread
- Principles of Finance 2e — 14.1 Correlation Analysis
- Principles of Finance 2e — 12.4 Historical Picture of Returns to Stocks
- Principles of Finance 2e — 15.5 Using Excel to Make Investment Decisions
- CAPITAL ASSET PRICES: A THEORY OF MARKET EQUILIBRIUM UNDER CONDITIONS OF RISKDOI 10.1111/j.1540-6261.1964.tb02865.x
- 하방위험을 고려한 포트폴리오 성과 평가DOI 10.22510/kjofm.2020.37.4.002
- 시간가변 상관관계를 이용한 아시아 주식시장간의 동조화와 분산투자효과에 대한 연구DOI 10.35527/kfedoi.2009.8.3.001
- Familiarity Breeds InvestmentDOI 10.1093/rfs/14.3.659
- Trying to Explain Home Bias in Equities and ConsumptionDOI 10.1257/jel.37.2.571
- The International Diversification Puzzle is Worse Than You ThinkDOI 10.3386/w5019
- Equity Portfolio DiversificationDOI 10.1093/rof/rfn005
- Talk and Action: What Individual Investors Say and What They DoDOI 10.1007/s10679-005-4997-z
- Financial literacy and portfolio diversificationDOI 10.1080/14697680902878105
- Naive Diversification Strategies in Defined Contribution Saving PlansDOI 10.1257/aer.91.1.79
- Portfolio Concentration and the Performance of Individual InvestorsDOI 10.1017/s0022109000004233
- Equilibrium Underdiversification and the Preference for SkewnessDOI 10.1093/revfin/hhm011
- Household FinanceDOI 10.1111/j.1540-6261.2006.00883.x