
Paperis Articles
Cities and Regions — Gathered Around the Fire, Seats Beyond Its Light
Why people gather in one place, and what that brings to the place they gather and the places they leave
Your field's papers, as audio
Pick your fields and journals — Paperis summarizes the key papers and turns them into audio. Listen on your commute.
Start Paperis free →Cities and Regions — Gathered Around the Fire, Seats Beyond Its Light
"Why Does Everyone Go to Seoul?"
On the evening when the holiday break ends, express bus terminals are crowded with people returning. Parents who came to see them off ask: "Why does everyone go to Seoul?" The answers vary by person. Some say it is because of jobs, others because of schools, and some because all their friends are there.
This article steps back a bit from the circumstances of any single person. It follows why people gather in one place, and what happens to that place and other places when they do. The examples in this article are drawn mostly from South Korea, but the concepts apply to any society.
We will use a single campfire as our guide. When a fire is lit in a field on a cold night, people gather around it. As new arrivals add logs one by one, the fire grows larger, and the larger fire can be seen from even farther away. The spot near the fire is warm but crowded, and the light from the fire reaches the seats far away less. We will carry this scene with us to the end.

Cities and Urbanization
A city is a place where many people live packed closely together, and most of them make a living by doing things other than farming. Cities emerged when people began to take on non-farming jobs to make a living (OpenStax Introduction Sociology 3e 18.1). It makes you wonder how many people need to gather to be called a city. When about 100,000 people gather in one place, it is generally seen as operating like a city. There is no fixed line between the city and the countryside (OpenStax Introduction Sociology 3e 20.2).
Urbanization is when the proportion of people living in cities grows out of the total population. During the industrialization period when factories grew, people moving from rural areas to cities following jobs increased significantly around the world (OpenStax Introduction Sociology 3e 20.2). According to 2018 United Nations data, 55 percent of the world's population lives in urban areas, with large differences across continents (OpenStax Introduction Sociology 3e 20.2).
According to one study, the pace at which South Korea's urbanization rate rose slowed around 1990, reaching 90.8 percent in 2009 (KCI ART001908301). To put it in terms of a campfire, urbanization is the process by which the proportion of people sitting near the fire among those in the field grows, and in South Korea, that proportion has filled up almost to the end.
The Reach Connected by Commuter Buses
At 7 a.m., a line forms at a bus stop in Gyeonggi Province, waiting for a commuter bus to Seoul. These people do not live in Seoul, but they spend most of their waking hours there. If you cut a city strictly along administrative boundary lines, the daily lives of these people become hard to see.
Suburbanization is when people who once lived in the city center move out to surrounding neighborhoods from which they can commute every day. In the United States, suburbs emerged as transportation improved, and as those suburbs spread farther outward, commuting times increased (OpenStax Introduction Sociology 3e 20.2). In Korea, planned metropolitan new towns built around Seoul are one form of the suburb. Four out of the five first-generation new towns turned toward declining populations starting around 2010 (DOI: 10.5762/KAIS.2017.18.6.710).
That is why, when looking at a city, we bundle its surrounding areas together with it. A metropolitan area is a scope that bundles one large city and the surrounding neighborhoods that commute to and from that city every day into a single mass. Sociology textbooks view a city, its suburbs, and the neighborhoods just beyond them as a single large mass (OpenStax Introduction Sociology 3e 20.2).
The Seoul Capital Area is a term that bundles Seoul and its surrounding areas of Incheon and Gyeonggi. One study groups Seoul and the Gyeonggi-Incheon region together as the capital area and compares it to the rest of the country (KCI ART002872145). Capital concentration is a phenomenon where a country's people, jobs, and money flock to the capital area. As of 2023, 50.8% of Korea's entire population lives in the capital area (KCI ART003192237). In a study looking at data from 1995 to 2007, capital concentration was extremely high across population, the economy, industry, money, and decision-making, and the higher a particular dimension's concentration was, the higher it grew over time (DOI: 10.18397/kcgr.2011.15.1.373). A future projection study starting from late 2020 forecasted that the share of the capital area versus non-capital areas will widen to 62.7% to 37.3% by the year 2100 (DOI: 10.7465/jkdi.2021.32.2.375). To put it in terms of a campfire, the capital area is the big fire that a lot of people are sitting around in the middle of Korea's field.
The Benefits That Come With Gathering
Suppose a developer who worked at a game company quits. If there are dozens of similar companies in the same neighborhood, it is easy to find the next job. Companies also find it easy to hire the people they need. There are even days when you hear about new technologies from someone at a neighboring company over lunch.
Agglomeration effects are the benefits that arise simply from people and companies gathering in one place. When workers cluster in a single city, their productivity increases, and these benefits also influence where people choose to live and work (DOI: 10.2139/ssrn.4191743). The paths through which these benefits arise are commonly divided into three: sharing facilities and labor, matching people with jobs, and learning from one another (DOI: 10.15793/kspr.2019.100..005). Finding a job in the developer story is matching, and the lunch table is learning. In a working paper looking at Dutch data, workers who lost their jobs in densely populated areas enjoyed agglomeration effects in matching with new jobs (DOI: 10.2139/ssrn.3516371).
These benefits have a property of growing on their own. Once they start rolling, they grow larger by their own force (DOI: 10.1111/deve.12167), creating a loop where things that have gathered cause more things to gather (KCI ART001857117). This is the scene where newcomers add firewood, and the growing fire is seen from farther away.
Can the size of these benefits be measured? In a working paper looking at Australian data (2001–2019), hourly wages were 1.6 to 2.7% higher when the population density of the place of residence doubled (DOI: 10.2139/ssrn.3938580). In South Korea, the wages of workers who moved from non-capital regions to the capital region rose immediately after the move. However, the wages did not show a steeper annual increase after the move. This result comes from a study examining 18 years of the Korea Labor and Income Panel Study (1998–2015), and the researchers interpreted this as a benefit on the sharing side, noting that they could not confirm benefits on the matching and learning sides (DOI: 10.15793/kspr.2019.100..005).
The benefits are not equal for everyone. In the Dutch working paper mentioned earlier, the agglomeration effect gained by highly educated workers was twice that of less educated workers (DOI: 10.2139/ssrn.3516371). The uneven distribution of skilled labor across cities is both a cause and a consequence of agglomeration effects (DOI: 10.1111/deve.12167). Therefore, separating the portion generated by gathering from the portion due to people who were already capable gathering in the first place, among the reasons why city dwellers earn more, is one of the problems researchers in this field pay the most attention to (DOI: 10.2139/ssrn.2505370). The Korea Labor and Income Panel study also tried to filter out the possibility that individuals with inherently superior abilities had moved using statistics (DOI: 10.15793/kspr.2019.100..005).
When people and companies gather, productivity is explained to rise through the paths of sharing, matching, and learning, and these benefits roll in the direction of gathering even more.
What Comes Along When the Fire Grows
When the fire grows, the surroundings get more crowded. Various costs that follow as cities grow put the brakes on agglomeration effects (DOI: 10.1111/deve.12167). If there were only a force pulling together and no force pushing apart, industries would clump into a single mass and inefficiencies like congestion would arise, making the tension where these two forces oppose each other important (KCI ART001857117).
This braking effect is also visible in numbers. A 2005 study examining manufacturing in the capital region found that while most of the capital region enjoyed agglomeration benefits, the gains from gathering further decreased where people had already gathered a lot, and the gains from gathering further were greater in places that were less gathered (KCI ART001139132). A preprint looking at cities in developing countries reported that as economic activity becomes denser, innovation ultimately diminishes, with that decrease standing out most in the largest cities (DOI: 10.21203/rs.3.rs-3065065/v1).
When looking at the country as a whole, even the questions being asked differ from study to study. One analysis looking at Korean data from 1990 to 2022 viewed population concentration in the capital region, exports, and economic growth as having a relationship where they call out to one another, with the force by which economic growth calls for capital region concentration being greater than the reverse direction. This is an analysis that looked at which side calls for the other more (DOI: 10.30776/JES.42.3.3). An analysis looking at the same period with a different model reported that, in the long run, population concentration in the capital region was negative for economic growth, which translates to meaning that the disadvantages of agglomeration appeared larger than the benefits (DOI: 10.22886/jkos.2024.29.3.1). In a study that modeled the concentration of U.S. employment, whether most of the concentration was due to agglomeration effects or to the natural advantages of the land flipped depending on how the model was set up (DOI: 10.2139/ssrn.574621).
When people gather, benefits and costs grow together, and which side is larger comes out differently across studies depending on the place, time, and how it is measured.
The Price of the Fireside Seat
Imagine someone who grew up outside Seoul and found their first job there, looking for a monthly-rent room. A price is attached to the fireside seat.
Housing cost burden is the share of earned income that goes toward living expenses paid month to month, like rent. Youth households living in the Seoul metropolitan area spent roughly 272,000 won more per month on housing than youth households in non-metropolitan areas under similar conditions. When compared under matched conditions, households living in the metropolitan area experienced greater burdens both measured by actual spending and felt by themselves (DOI: 10.26700/shuri.2025.12.15.3.79).
Another study looked at the benefits gained as well. In a study examining young monthly-rent tenant households using the 2020 Korea Housing Survey, Seoul households had the highest security deposits, monthly rent, and housing costs relative to income among the four regions, and their homes were on average the narrowest and oldest. Satisfaction with the home itself was higher for non-metropolitan households. However, satisfaction with the overall residential environment was noticeably higher for Seoul households, and that difference came from satisfaction with urban infrastructure (KCI ART002872145).
Whom does the weight of the price fall upon? In a study looking at Korea Welfare Panel Study data, the relationship where housing cost burden leads to living deprivation appeared only in tenant households. Households categorized by this study as having an “Excessive Burden” (30–50%) were more likely to experience deprivation in household living outside the home, while those categorized as having a “Severe Burden” (50% or more) were more likely to experience deprivation in the home itself (DOI: 10.23286/gri.2024.26.1.009).
The fireside seat is as expensive as it is warm, and the weight of that price falls more heavily on those who rent their homes.
When Money Flows Into an Old Neighborhood
A cafe pops up in an old alleyway, followed by another; on weekends, the streets teem with people taking pictures, and before long, a different sign hangs over the spot of an old shop. When stories like this appear in Korean news, a certain term often tags along.
In 1964, sociologist Ruth Glass gave this phenomenon a name after watching well-off people move into a working-class neighborhood in Islington, northern London, and transform it (DOI: 10.1002/9781444351071.wbeghm248). Gentrification is the process by which working-class neighborhoods or vacant land are transformed into places where wealthier people live or do business. Today, it happens on a much larger scale than before, alongside large-scale development (DOI: 10.1002/9781444351071.wbeghm248). In Korea, this word is used with various meanings, and Korean research has mostly dealt with Seoul, focusing more on commercial districts than housing (DOI: 10.23841/egsk.2024.27.4.344).
Displacement is when rising prices force the people or shops that were originally there to leave against their will. Because a neighborhood changing and people being pushed out may not be the same thing, studies measure the two separately.
There is evidence on the side where displacement is pronounced. A study looking at London census data found that displacement clustered around the edges of gentrified zones. The authors wrote that it is difficult to separate being pushed out from natural changes, yet concluded that displacement appears common among certain groups and that the process is socially and psychologically harmful (DOI: 10.1080/0042098002339). In the U.S. Panel Study of Income Dynamics (1987–2009), gentrification directly pushed out renters. While homeowners sometimes moved unwillingly due to property tax burdens, such moves were not more common in gentrified neighborhoods (DOI: 10.1177/1078087416666959).
There is also evidence for viewing gentrification and displacement separately. A preprint examining roughly 6 million eviction filings across 72 major U.S. metropolitan areas (2000–2016) found that the majority of evictions occurred in low-income neighborhoods that did not experience gentrification. Eviction rates in gentrified neighborhoods dropped by more than in comparable low-income neighborhoods. The authors conclude that looking only at gentrified neighborhoods misses most forced evictions, that struggling neighborhoods faced eviction pressure whether gentrification happened or not, and that eviction is a problem deeply rooted in such neighborhoods (DOI: 10.31235/osf.io/pyfa8).
There are also cases where displacement barely occurred. In the surfing tourist spot of Yangyang, Gangwon Province, commercial facilities and land prices rose and residents' living environments worsened, but original residents were rarely pushed out. The reasons cited were that the tourist commercial district formed on vacant beach land away from the residents' living sphere, and that residents were older with a deep attachment to their hometown and strong ties among neighbors (DOI: 10.22776/kgs.2024.59.1.91).
It also varies depending on the timing and the neighborhood. Seoul's commercial gentrification index (2015–2021) peaked in 2018, eased off, and then saw commercial districts decline rapidly due to COVID-19 after 2020. The patterns differed by district: areas with strong residential functions saw almost no progress, while some areas in Gangbuk became more severe. In this study, no noticeable relationship appeared between gentrification and the vacancy rate of shops (DOI: 10.30902/jrea.2022.8.3.173). Research results also conflict on whether transportation investments like new train stations lead to gentrification, with local neighborhood circumstances playing a major role (DOI: 10.31235/osf.io/5ka2g).
Studies generally point to three main avenues for reducing displacement: protecting tenants, regulating ownership and development, and building resident power. The authors of a systematic literature review synthesizing these avenues conclude that preventing the negative impacts of gentrification requires more than just reducing displacement (DOI: 10.1111/gec3.12355). To put it in terms of a campfire, when the seats near the fire get more expensive, some people who were sitting there first are pushed backward, while others manage to hold their ground.
Gentrification is the transformation of a neighborhood, and whether it leads to the displacement of original residents depends on the place, the timing, and whether they own or rent their homes.
Where the Light is Dimmer
When you look by age at who leaves and who enters in cities, counties, and districts with shrinking populations, the patterns differ. In this study of districts classified as at risk of decline, the population shrank mainly because more people in their 20s and 30s left than moved in. Conversely, for those in their 40s and 50s and those aged 60 and older, more people moved in than left. Income, education, and healthcare acted to pull people in, while jobs acted to hold onto leaving residents, and what split the movements of people in their 20s and 30s were income and jobs (DOI: 10.31553/kpsr.2024.3.28.1.105).
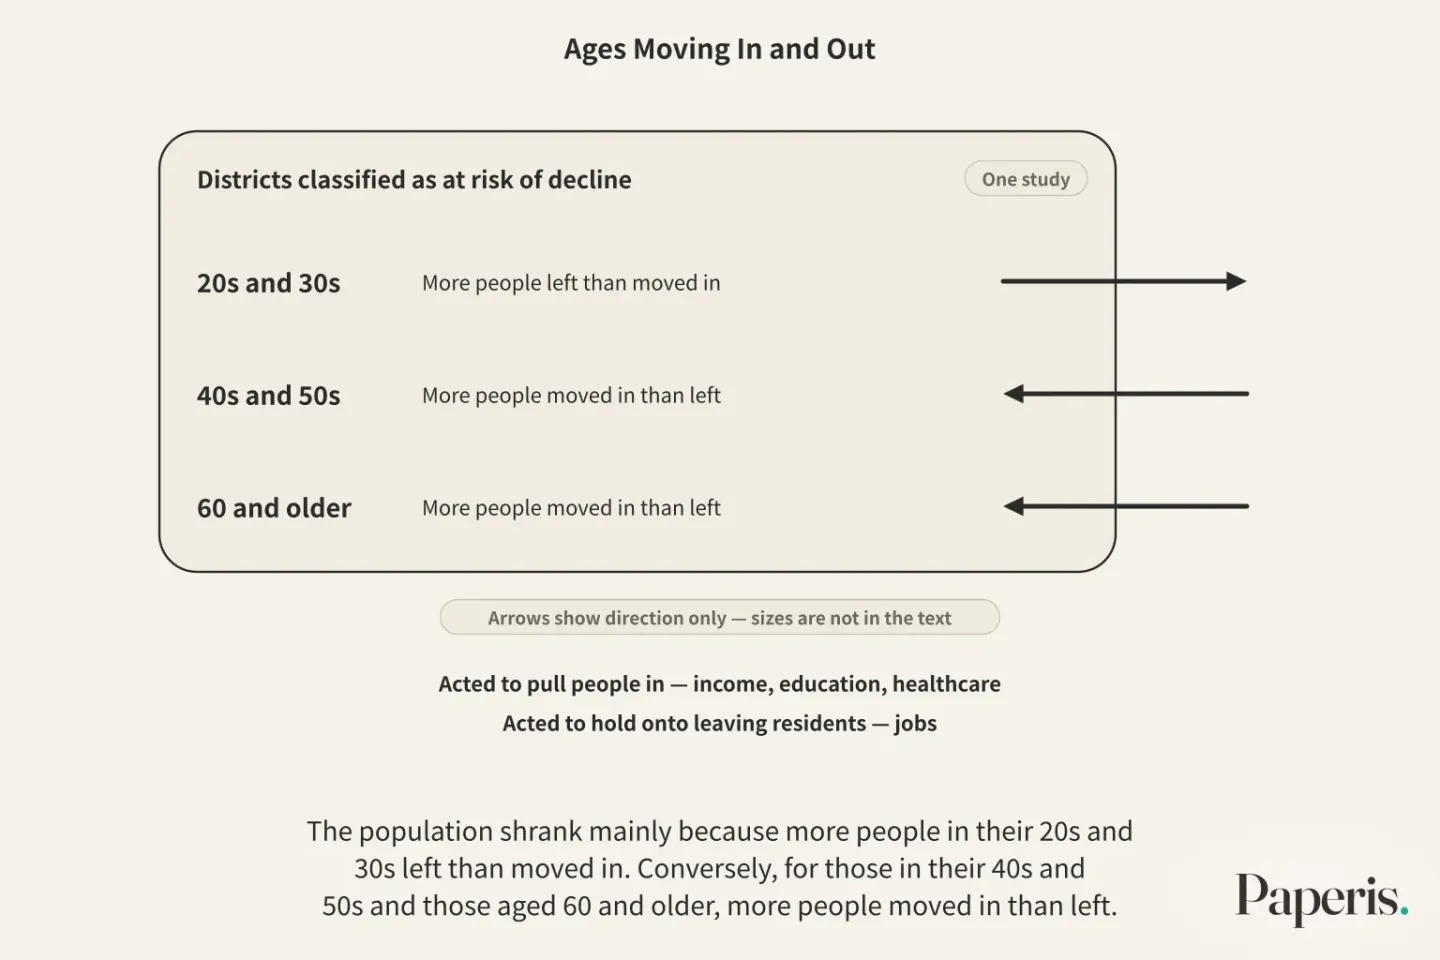
Regional decline refers to a situation where a region's population drains out and dwindles, making it difficult to sustain livelihoods and communities there. Research uses this term to measure how severe the risk is in each region, and the size of the risk varies depending on what is used to measure it.
Dividing the data by a newly proposed index that includes birth rates, aging, and the concentration of young people in the capital area, the capital area showed a low risk of decline. The proportion of non-capital areas classified as at risk of decline was not a single value but came out as a range of 21 to 46%. Even within non-capital areas, the Chungcheong region was relatively stable, while the Gangwon and Gyeongnam-Gyeongbuk regions and the Jeju and Jeonra regions showed high risks (DOI: 10.7465/jkdi.2025.36.1.71).
Regional disparity is the degree to which living conditions such as jobs, income, hospitals, and schools spread apart depending on where people live. In data from 1995 to 2007, the higher the concentration in the capital area, the greater the regional disparity, and the two moved together in a statistically meaningful way (DOI: 10.18397/kcgr.2011.15.1.373). This result is a correlation showing they moved together, and it does not show that one side caused the other. One survey reviewing urban economics research noted that spatial concentration in cities risks widening regional disparities and stirring political and social tension within a country (DOI: 10.1111/deve.12167).
The thoughts of local young people have also been studied. In a study analyzing the thoughts of 24 local young people, the youth saw regional decline as a result created by structural imbalances rather than individual choices, and their thoughts did not split neatly into the two options of “staying or leaving”. The researchers looked at this phenomenon from the perspective that rational choices piled up by individuals lead to an outcome the region as a whole did not want (DOI: 10.14696/jcs.2025.12.25.4.98). The mindset of staying has been studied as well. In a survey of 700 Gimhae citizens, the better they viewed housing, safety, income, and job conditions, the stronger their desire to keep living there was, and among perceptions of disparities with other regions, only the perception of disparity with a nearby neighboring city lowered that desire (DOI: 10.22783/krila.2026.40.3.117).
Small cities also have their own pulling forces. In shop data from Gangneung (2000–2019), shops in places where businesses of the same industry clustered survived longer, and that relationship grew stronger in the 2010s. Having various industries densely mixed together was actually negatively related to shop survival (DOI: 10.22783/krila.2021.35.4.313).
Regional disparities are also analyzed in connection with having children. In a study looking at data from 2010 to 2019, viewed at the unit of 229 cities, counties, and districts, economic growth moved in the same direction as childbirth, and viewed at the unit of 16 cities and provinces, the greater the disparity in production and land price changes between regions, the lower the birth rate (DOI: 10.15793/kspr.2024.121..001).
Balanced development refers to a policy goal aimed at making various regions across a country develop evenly. In South Korea, policies bearing this name have been pursued multiple times.
The campfire metaphor reveals its limits here. The metaphor spoke as if a growing fire calls people over, but in reality, people do not move just by looking at the light. Attachment to one's hometown, bonds with neighbors, and comparisons with nearby cities together decide whether someone stays or leaves. There is not just one big fire in the field either, so even beside a small fire, there is its own warmth.
When people gather on one side, regions arise where the younger generation drains out, and studies have sought the reasons in things like income, jobs, and living conditions.
Following One Person's Move
Let us follow one person as an example of what we have learned. Suppose Minji, a 28-year-old who grew up in a rural county, moves to a company in the capital area. The numbers below are all averages and may not apply exactly to Minji as an individual.
If Minji's hometown is a county classified as at risk of decline, she is captured in the hometown's demographic statistics as one of the 20- and 30-somethings where more people left than came in. Such counties sometimes see people in their 40s, 50s, or ages 60 and older move in (DOI: 10.31553/kpsr.2024.3.28.1.105).
At her new workplace, Minji is both someone who adds firewood and someone who warms herself by the fire. In Korean data, moves like this on average tended to see wages rise immediately after the relocation, after which wages did not rise more steeply each year (DOI: 10.15793/kspr.2019.100..005).
Housing must be calculated separately. It costs roughly 272,000 won more per month in housing expenses than for young households in non-capital regions with similar conditions (DOI: 10.26700/shuri.2025.12.15.3.79). Young monthly-rent households in Seoul had homes that were on average the smallest and oldest, but their satisfaction with urban infrastructure was high (KCI ART002872145).
Minji's move was a calculated choice for Minji. When many such choices accumulate, the population numbers of her hometown change. In the previous study, what divided the movements of 20- and 30-somethings moving in and out was the income and jobs of that region (DOI: 10.31553/kpsr.2024.3.28.1.105).
Where to Look Next
The problem of separating out the share of people who were already like that when explaining why city people earn more is addressed in terms of health research by "If People Who Take It Live Longer, How Were They Different to Begin With? — Confounding". How the price of a spot near the fire, namely monthly rent, is determined leads into "Supply and Demand: Who Sets the Price?", and costs that are not fully captured in price, such as congestion, can be seen in "When Markets Fail — The Moments a Price Cannot Tell the Whole Story". What you give up when choosing where to live is covered by "Scarcity and Opportunity Cost: What Do You Give Up When You Choose?". The numbers measuring jobs are in "Unemployment and Employment — Those in Line, Those Who Left It".
Childbirth, aging, and migration are covered in "Population — A House Divided into Floors by Age, and the People Who Move Up One Floor Each Year". Income gaps and social strata beyond regions are covered in "Inequality and Social Stratification — This Month's Allowance, the Piggy Bank Handed Down". How an individual's choices and the framework surrounding those choices intertwine continues in "What Is Society? — A Path Worn by Many Feet, and the Steps That Choose It".
Source Papers
- "Introduction to Sociology 3e — 20.2 Urbanization" (2021) — OpenStax Introduction Sociology 3e 20.2 — Rural areas and cities exist on a continuum, and when roughly 100,000 people gather, they generally operate like a city. During industrialization, people moved from rural areas to cities following factory jobs. Along with improved transportation, commuting-capable suburbs emerged. In the U.S., suburban sprawl has led to congestion and increased commuting times, forming metropolitan areas (city + suburbs + the outer ring). 55% of the world's population lives in urban areas (UN 2018).
- "Introduction to Sociology 3e — 18.1 Economic Systems" (2021) — OpenStax Introduction Sociology 3e 18.1 — With the division of labor outside of farming, villages grew into towns and cities. When cities become the center of economic activity, workers move from rural areas to cities.
- "A Study on the Correlation between the Concentration in the Capital Region and Regional Disparities" (2011) — DOI: 10.18397/kcgr.2011.15.1.373 — 32 variables across 9 dimensions from 1995 to 2007. South Korea's concentration in the capital region is very high in population, economy, industry, money, and decision-making, and has deepened over time. Concentration in the capital region and regional disparities show a significant positive correlation.
- "Analysis of Determinants of Residential Environment and Housing Cost Burden for Youth Single-Person Rent Households by Region" (2022) — KCI ART002872145 — 2020 Housing Survey. Single-person youth rent households in Seoul face the highest deposits, rents, and housing costs relative to income, and their housing is the narrowest and oldest. While housing satisfaction is higher outside the capital region, overall residential environment satisfaction is markedly higher in Seoul, driven by satisfaction with urban infrastructure.
- "Labor Market Agglomeration Economies" (2022) — DOI: 10.2139/ssrn.4191743 — Review chapter. The benefits of worker concentration in cities boost productivity and influence location choices.
- "Microeconomic Mechanisms of Agglomeration Economies and the Wage Gap between Capital Region and Non-Capital Region Workers" (2019) — DOI: 10.15793/kspr.2019.100..005 — Korea Labor and Income Panel Study (1998–2015). The micro-mechanisms of agglomeration are sharing, matching, and learning. An immediate wage increase right after moving to the capital region (a level effect tied to sharing) is confirmed, but gradual wage growth after moving (matching and learning) is not confirmed. Attempts are made to control for omitted ability bias.
- "Endogenous Local Labour Markets, Regional Aggregation and Agglomeration Economies" (2020) — DOI: 10.2139/ssrn.3516371 — Working paper. Dutch administrative data. The agglomeration externality for high-skilled workers is twice that of low-skilled workers. In dense labor markets, unemployed workers enjoy agglomeration effects in job matching.
- "Human Capital and Agglomeration Economies in Urban Development" (2018) — DOI: 10.1111/deve.12167 — Survey. Agglomeration economies are cumulative, so once set in motion, they grow on their own, with costs tied to city size acting as a brake. The uneven distribution of skilled labor is both a cause and a consequence of agglomeration, and spatial concentration widens regional disparities, risking political and social tension.
- "A Study on the Spillover of Seoul's Agglomeration Economy Effects to Other Regions" (2014) — KCI ART001857117 — Cumulative causality where agglomeration begets agglomeration. Because centripetal forces alone create inefficiencies such as congestion, tension with centrifugal forces is important.
- "Agglomeration Economies and the Urban Wage Premium in Australia" (2021) — DOI: 10.2139/ssrn.3938580 — Working paper. HILDA 2001–2019. When regional density doubles, wages are 1.6% to 2.7% higher.
- "The Empirics of Agglomeration Economies" (2014) — DOI: 10.2139/ssrn.2505370 — Survey. The most crucial concern in estimating agglomeration effects is endogeneity at the regional and individual levels (including workers' location choices).
- "An Analysis of Manufacturing Agglomeration Economies in the Capital Region" (2005) — KCI ART001139132 — Agglomeration economies exist across most of the capital region. In areas with higher concentration, agglomeration economies diminish, whereas less concentrated areas generate stronger agglomeration economies.
- "Urban agglomeration and innovation in developing economies" (2023) — DOI: 10.21203/rs.3.rs-3065065/v1 — Preprint. In developing countries, as urban economic density increases, innovation ultimately declines, a pattern most prominent in the largest cities.
- "An Analysis of the Causal Relationship between Population Concentration in the Capital Region, Exports, and Economic Growth in Korea" (2024) — DOI: 10.30776/JES.42.3.3 — 1990–2022. Mutual causality exists among population concentration in the capital region, exports, and economic growth, with economic growth having a relatively greater explanatory power in driving concentration in the capital region.
- "An Analysis of the Impact of Population Concentration in the Capital Region on Korea's Economic Growth: Focusing on the Relationship with Exports" (2024) — DOI: 10.22886/jkos.2024.29.3.1 — ARDL from 1990 to 2022. In the long run, population concentration in the capital region has a negative impact on economic growth, which the authors interpret as meaning that agglomeration disadvantages outweigh agglomeration benefits.
- "On the Contribution of Agglomeration Economies to the Spatial Concentration of U.S. Employment" (2004) — DOI: 10.2139/ssrn.574621 — Whether U.S. employment concentration stems from natural advantages or increasing returns depends on how the model accounts for the stability of low-density regions.
- "The Impact of Residing in the Capital Region on Objective and Subjective Housing Cost Burdens of Youth Households" (2025) — DOI: 10.26700/shuri.2025.12.15.3.79 — Propensity score matching. Youth households in the capital region spend roughly 272,000 won more per month on housing costs than those outside the capital region, and residing in the capital region increases both objective and subjective housing cost burdens.
- "The Impact of Housing Cost Burden on Material Deprivation" (2024) — DOI: 10.23286/gri.2024.26.1.009 — 17th Korea Welfare Panel Study. The deprivation effect of housing cost burdens occurs only among renter households, increasing the likelihood of non-housing deprivation by 30% to 50%, and housing deprivation by 50% or more.
- "Gentrification and displacement" (2013) — DOI: 10.1002/9781444351071.wbeghm248 — Encyclopedia entry. Ruth Glass coined the term in 1964 after observing Islington, London. Today, gentrification happens on a much larger scale alongside large-scale development.
- "An SQLR on Gentrification Research in Korea" (2024) — DOI: 10.23841/egsk.2024.27.4.344 — Systematic quantitative literature review of Korean papers from 2007 to 2023. The term is used polysemously, and research focuses on Seoul and commercial gentrification.
- "Measuring Gentrification and Displacement in Greater London" (2000) — DOI: 10.1080/0042098002339 — Displacement effects concentrate around the periphery of gentrified zones. Replacement and displacement are difficult to disentangle, but the study concludes they are common among certain groups and socially and psychologically harmful.
- "Gentrification, Property Tax Limitation, and Displacement" (2016) — DOI: 10.1177/1078087416666959 — PSID 1987–2009. Property tax pressures can prompt involuntary moves among homeowners, but this is not more common in gentrifying neighborhoods; gentrification directly displaces renters.
- "Beyond Gentrification: Housing Loss, Poverty, and the Geography of Displacement" (2023) — DOI: 10.31235/osf.io/pyfa8 — Preprint. Over 6 million eviction filings across 72 U.S. metropolitan areas (2000–2016). Most evictions occurred in low-income neighborhoods without gentrification, and eviction rates declined more in gentrifying neighborhoods. Disadvantaged neighborhoods experience eviction pressure regardless of gentrification, leading the author to conclude that eviction is an enduring fixture of such neighborhoods.
- "The Evolutionary Patterns of Fishing Village Gentrification Induced by Marine Leisure Tourism and Local Residents' Attitudes" (2024) — DOI: 10.22776/kgs.2024.59.1.91 — Yangyang Population and Jukdo Beach. Increases in commercial facilities, land prices, and worsening living conditions appeared, but displacement of original residents was rare, driven by commercial districts separated from residential areas, as well as residents' advanced age, place attachment, and social ties.
- "An Exploratory Analysis of Commercial Gentrification Indices and Vacancy Rates" (2022) — DOI: 10.30902/jrea.2022.8.3.173 — Seoul 2015–2021. 2018 was the most severe year, easing in 2019, and declining due to COVID-19 after 2020. Differences exist across autonomous districts, with no clear correlation to vacancy rates.
- "Transit-Induced Gentrification and Displacement: The State of the Debate" (2021) — DOI: 10.31235/osf.io/5ka2g — Empirical findings on the relationship between transit investment and gentrification are mixed, and local context matters.
- "Toward a socially acceptable gentrification: A review of strategies and practices against displacement" (2017) — DOI: 10.1111/gec3.12355 — Systematic literature review. Strategies to mitigate displacement fall into three categories: tenant protection, ownership and development control, and community capacity building. The study concludes that merely reducing displacement is insufficient to prevent negative impacts.
- "Causes of Local Extinction: Focusing on the Impact Factors of Population Migration" (2024) — DOI: 10.31553/kpsr.2024.3.28.1.105 — Population decline in decline-risk basic local governments is mainly driven by net outflows of people in their 20s and 30s, while those in their 40s, 50s, and 60+ show net inflows. Income, education, and medical services act as pull factors, whereas jobs act as a deterrent to out-migration.
- "Proposing a New Population Extinction Index Reflecting Fertility Rates, Aging, and Youth Concentration in the Capital Region" (2025) — DOI: 10.7465/jkdi.2025.36.1.71 — The new index puts the proportion of decline-risk regions outside the capital region at 21% to 46%, whereas the capital region shows low extinction risk, with clear regional disparities outside the capital region.
- "The Paradox of 'Rational Choices' Leading to Local Extinction" (2025) — DOI: 10.14696/jcs.2025.12.25.4.98 — Q methodology, 24 young adults. Young people perceive local extinction as the product of structural imbalance, explaining it as a fallacy of composition where rational choices accumulate.
- "Decentralization Era: Exit or Loyalty?" (2026) — DOI: 10.22783/krila.2026.40.3.117 — Survey of 700 Gimhae citizens. More positive evaluations of housing, living, safety, income, and job conditions correspond to higher residential loyalty, while among perceived disparities, only the perceived disparity with neighboring cities lowers residential loyalty.
- "Are Store Locations Still Important? : Focusing on Agglomeration Economies in Gangneung City" (2021) — DOI: 10.22783/krila.2021.35.4.313 — Gangneung 2000–2019. The link between same-type store specialization and store survival grew stronger in the 2010s, whereas the concentration of different-type stores shows a negative relationship with survival.
- "The Impact of Economic Growth and Regional Disparities on the Total Fertility Rate" (2024) — DOI: 10.15793/kspr.2024.121..001 — 2010–2019. Across 229 municipal districts, economic growth has a positive (+) effect on fertility, whereas across 16 provinces and metropolitan cities, regional disparities in GRDP and land price changes have a negative effect on the total fertility rate.
- "An Analysis of the Impact of Suburban New Town Development on the Decline of Old Urban Centers in Core Cities" (2014) — KCI ART001908301 — South Korea's urbanization rate growth began to slow around 1990, reaching 90.8% in 2009 as urbanization entered its terminal stage.
- "A Comparative Study on the Aging Characteristics of Suburban New Towns in the Seoul Metropolitan Areas of Korea and Japan" (2017) — DOI: 10.5762/KAIS.2017.18.6.710 — Since 2010, the population of four first-generation new towns in the capital region, excluding Bundang, has shifted into a downward trend.
- "The Effect of the Proportion of the Elderly Population in the Capital Region on Housing Prices" (2025) — KCI ART003192237 — The capital region is an area where 50.8% of the total population was concentrated as of 2023.
- "Inferences on the Proportions of Population Distribution across Local Governments, the Capital and Non-Capital Regions, and Regional Zones" (2021) — DOI: 10.7465/jkdi.2021.32.2.375 — The population proportion of the capital region versus non-capital region was roughly 51% to 49% in December 2020, and is projected to reach 62.7% to 37.3% by 2100.
Sources (32)
- Introduction to Sociology 3e — 20.2 Urbanization
- Introduction to Sociology 3e — 18.1 Economic Systems
- 수도권 집중과 지역격차의 상관관계에 관한 연구DOI 10.18397/kcgr.2011.15.1.373
- Labor Market Agglomeration EconomiesDOI 10.2139/ssrn.4191743
- 집적경제의 미시적 메커니즘과 수도권-비수도권 근로자의 임금격차DOI 10.15793/kspr.2019.100..005
- Endogenous Local Labour Markets, Regional Aggregation and Agglomeration EconomiesDOI 10.2139/ssrn.3516371
- Human Capital and Agglomeration Economies in Urban DevelopmentDOI 10.1111/deve.12167
- Agglomeration Economies and the Urban Wage Premium in AustraliaDOI 10.2139/ssrn.3938580
- The Empirics of Agglomeration EconomiesDOI 10.2139/ssrn.2505370
- Urban agglomeration and innovation in developing economiesDOI 10.21203/rs.3.rs-3065065/v1
- 우리나라 인구의 수도권 집중, 수출, 그리고 경제 성장 간의 인과관계 분석DOI 10.30776/jes.42.3.3
- 인구의 수도권 집중 현상이 우리나라 경제성장에 미치는 영향 분석: 수출과의 관계를 중심으로DOI 10.22886/jkos.2024.29.3.1
- On the Contribution of Agglomeration Economies to the Spatial Concentration of U.S. EmploymentDOI 10.2139/ssrn.574621
- 수도권 거주가 청년가구의 객관적·주관적 주거비부담에 미치는 영향DOI 10.26700/shuri.2025.12.15.3.79
- 주거비 부담이 물질적 박탈에 미치는 영향DOI 10.23286/gri.2024.26.1.009
- Gentrification and displacementDOI 10.1002/9781444351071.wbeghm248
- 한국의 젠트리피케이션 연구에 대한 SQLRDOI 10.23841/egsk.2024.27.4.344
- Measuring Gentrification and Displacement in Greater LondonDOI 10.1080/0042098002339
- Gentrification, Property Tax Limitation, and DisplacementDOI 10.1177/1078087416666959
- Beyond Gentrification: Housing Loss, Poverty, and the Geography of DisplacementDOI 10.31235/osf.io/pyfa8
- 해양레저관광에 의한 어촌의 젠트리피케이션 전개 양상과 지역주민 태도DOI 10.22776/kgs.2024.59.1.91
- 상업 젠트리피케이션 지수와 공실률에 대한 탐색적 분석DOI 10.30902/jrea.2022.8.3.173
- Transit-Induced Gentrification and Displacement: The State of the DebateDOI 10.31235/osf.io/5ka2g
- Toward a socially acceptable gentrification: A review of strategies and practices against displacementDOI 10.1111/gec3.12355
- 지방소멸의 원인: 인구이동의 영향요인을 중심으로DOI 10.31553/kpsr.2024.3.28.1.105
- 출산율, 고령화, 청년층의 수도권 집중화를 반영한 새로운 인구소멸지수 제안DOI 10.7465/jkdi.2025.36.1.71
- 지방소멸로 이어지는 '합리적 선택'의 역설DOI 10.14696/jcs.2025.12.25.4.98
- 지방분권 시대, 이탈(Exit)인가 충성(Loyalty)인가DOI 10.22783/krila.2026.40.3.117
- 상점 입지는 여전히 중요한가? : 강릉시 집적경제를 중심으로DOI 10.22783/krila.2021.35.4.313
- 경제성장과 지역 격차가 합계출산율에 미치는 영향DOI 10.15793/kspr.2024.121..001
- 한일 수도권 교외 신도시 고령화 특성 비교 연구DOI 10.5762/kais.2017.18.6.710
- 지방자치단체 및 수도권과 비수도권, 권역별 인구분포 비중에 대한 추론DOI 10.7465/jkdi.2021.32.2.375