
Paperis Articles
Family — The Table We Share Every Night, and the Big Table We Set for the Holidays
What does a headline like 'more people live alone' actually count? Telling families apart from households, and tracing how family forms and the sharing of housework and care have changed.
Your field's papers, as audio
Pick your fields and journals — Paperis summarizes the key papers and turns them into audio. Listen on your commute.
Start Paperis free →Family — The Table We Share Every Night, and the Big Table We Set for the Holidays
How Many People Are in Your Household?
Let us take the evening after a holiday weekend as an example. A thirty-five-year-old office worker returns to a studio apartment where they live alone. During the holiday, they ate meals at their parents' house, gave allowance money to their nieces and nephews, and even booked a hospital appointment for their father. Yet in a survey counting how people live, this person may be recorded as a single individual living alone.
"How many people live with me?" and "Who are my people?" yield different answers even for the same person. When the news reports that "the number of people living alone has increased," we must first know what that number is counting in order to read its meaning. The examples in this article are drawn mostly from South Korea, but the concepts apply to any society.
As guides, we will use two dinner tables. One is the everyday dinner table where people sit facing each other in the same home every evening, and the other is the holiday feast. The office worker above sets a dinner table alone every day, but more than ten pairs of spoons are laid out at the holiday feast table. We commonly call the people gathered around the large holiday feast table family.
Every Day's Dinner Table and the Holiday Feast
A family is usually a group of people recognized by society as family—connected by blood, marriage, or adoption, bound together emotionally, and forming a single economic unit. Textbooks place unmarried couples living together inside this "usually" as well. This definition does not include the condition of living in the same house (OpenStax Introduction Sociology 3e 14.1).
Sociology views the family as one of society's social institutions alongside marriage (OpenStax Introduction Sociology 3e 14.1). A social institution is a framework of beliefs and behaviors that society has solidified over a long time to accomplish essential tasks, such as family, schools, markets, and the state. What tasks has the family carried out as such a framework? From the sociological perspective that focuses on what families do in society, raising children to send out into the world and looking after aging parents are commonly cited together (OpenStax Introduction Sociology 3e 14.1).
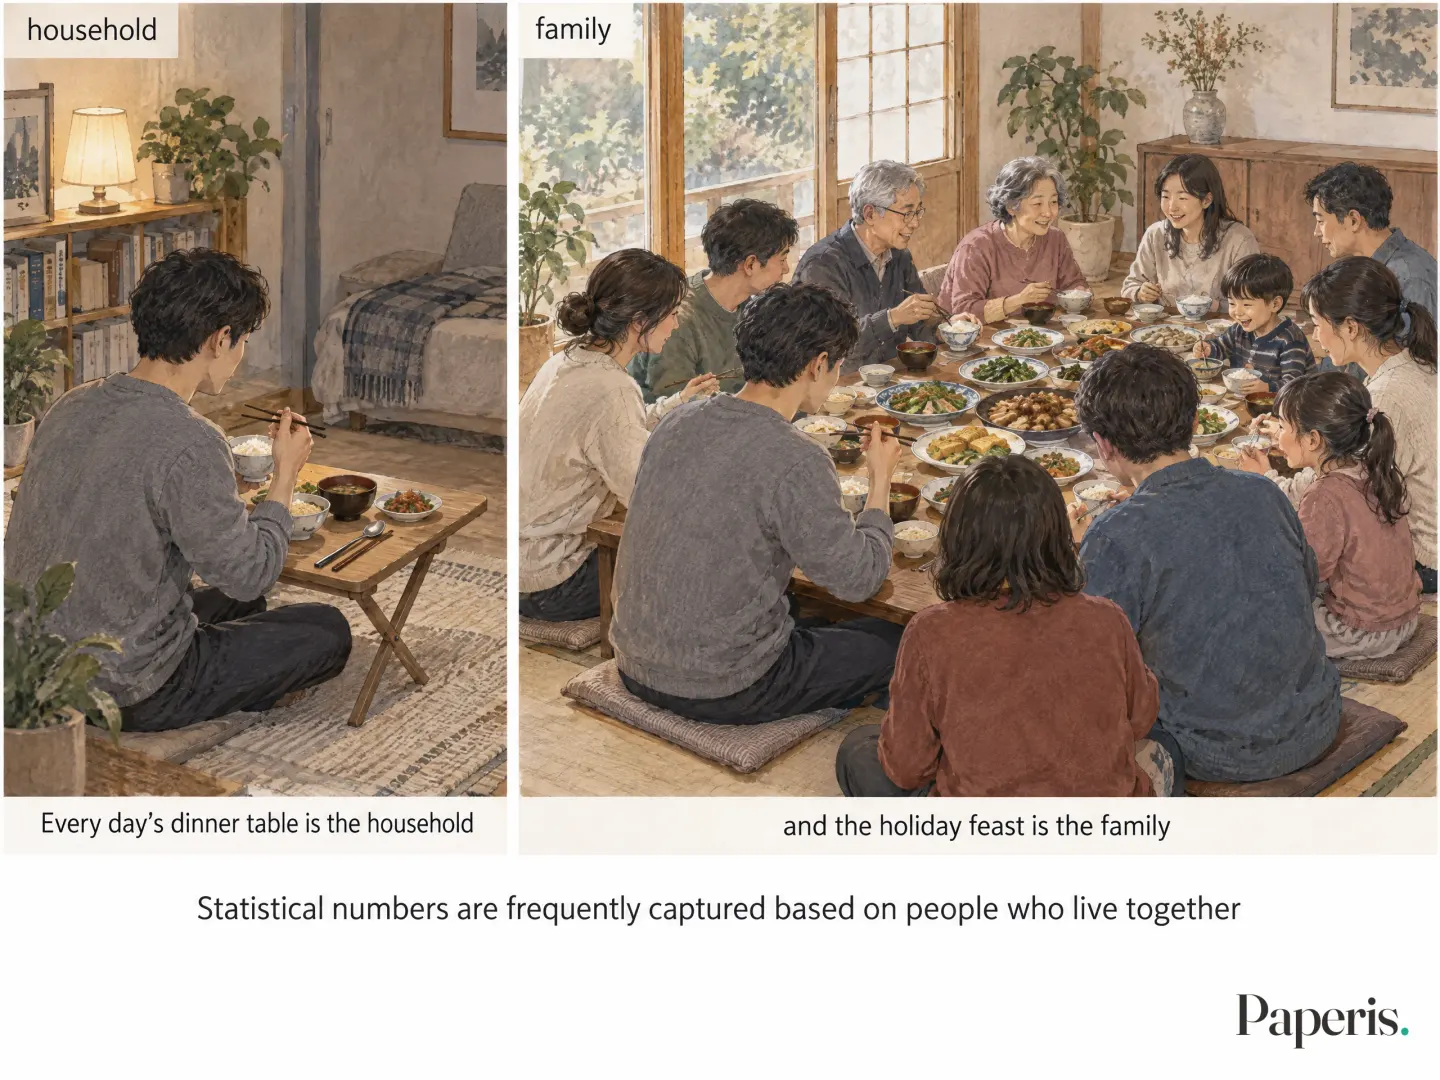
A household is a unit of people living together and sharing a livelihood, and living alone makes a single person their own household. If family asks "Who are my people?", a household asks "Who lives in the same house and shares a life together?" Every day's dinner table is the household, and the holiday feast is the family. However, because the criterion that divides households is sharing a livelihood rather than eating together, the dinner table is an approximation.
Which of the two do official statistics count? Taking the United States as an example, the Census Bureau defines a family as "two or more people related by birth, marriage, or adoption who live together" and counts them with the same yardstick over the years, a yardstick that does not include unmarried cohabiting partners (OpenStax Introduction Sociology 3e 14.1). Like this, statistical numbers are frequently captured based on people who live together.
The holiday feast for someone living alone can be wider than expected. In a study that deeply interviewed 12 people in their 20s to 60s living alone without marrying, a considerable number considered not only parents and siblings but even nieces and nephews to be their family. During early and middle adulthood, many were people who primarily cared for their parents and helped with the households of their siblings. It was only later in life that the scope of family actually narrowed down to just oneself (DOI: 10.20970/kasw.2024.76.2.001). Because it is the stories of 12 people, it does not tell us how common this is, but it shows that a life like the office worker's at the beginning actually exists.
Statistical numbers are frequently captured based on people who live together, so they are not the same as the family gathered around the holiday feast.
The Road the Dining Table Has Shrunk
How many people, on average, sit at a daily Korean dinner table? Looking at the results of the Ministry of Gender Equality and Family’s 2020 Family Survey, which a study analyzing 2020 dramas included as comparative data, the average household size in Korean households was 2.3 people, and in terms of generational composition, households where two generations live together, such as parents and children, were the most common (DOI: 10.21478/family.33.4.202112.003).
A common picture of a two-generation household is a nuclear family. A nuclear family is a family where married parents and their children live in the same house. Textbooks treat a household where unmarried parents live with a child separately as a variant of the nuclear family (OpenStax Introduction Sociology 3e 14.2). An extended family is a family where, in addition to parents and children, other relatives live together in a single household. To put it in terms of the dinner table, three generations commonly sit at the table of an extended family, while two generations sit at the table of a nuclear family.
Classical population theory predicted that once the changes in which deaths and births decrease together come to an end, households everywhere would converge toward nuclear families consisting of married couples and their children (DOI: 10.1002/9781405165518.wbeoss059.pub2). The reality has branched into more paths than that. The changes in families that occurred in the West over the past half-century are spreading to other countries undergoing economic development, technological shifts, and changes in ideas, but each country's traditional family system is adapting in its own different ways (DOI: 10.1111/fare.12361).
This change remains in Korean middle and high school home economics textbooks as well. Earlier textbooks depicted the nuclear family as an exemplary, ideal family, and emphasized its utility in supporting social order and national development. Coming closer to later periods, they cover a greater variety of family forms, and the criteria dividing families have shifted from structures like marriage and blood ties to relations like affection, care, and conversation (KCI ART003343165).
The shrinking of the dinner table also appears in statistics from other countries. Italy's average household size decreased from 3.35 people in 1971 to 2.24 people in 2021 (DOI: 10.71014/sieds.v77i2.185). As for the evidence examined in this article, because South Korea's long-term trends cannot be drawn by connecting numbers, South Korea only notes a single point in time, 2020. Even in countries where dinner tables have shrunk, those tables have not adjusted into a single uniform shape everywhere.
Setting the Table Alone
Single-person households on screen and in real life are of different ages. Among 124 main characters in 64 Korean dramas broadcast in 2020, more characters lived alone who were men than women, people in their 30s were the majority, and most were unmarried. A single-person household is a household where one person makes a living and lives alone. In the Family Status Survey of the same year compared by the same study, real single-person households differed from the dramas. People aged 60 or older were the majority, and their marital statuses varied (DOI: 10.21478/family.33.4.202112.003).
The table set alone on screen usually belongs to a young office worker, which means older people actually sit in front of that table much more often. We look at the trend of the aging population itself in "Population — A House Divided into Floors by Age, and the People Who Move Up One Floor Each Year".
The table of young single-person households can also be examined separately. In a study looking at 4,291 youth single-person households living apart from their parents from the 2024 Youth Life Status Survey, the larger the share of housing costs among living expenses, the smaller the share of food expenses. Taken as a whole, the share of housing costs was not clearly linked to life satisfaction, but a connection lowering satisfaction through other spending like communication costs or entertainment and culture costs was confirmed (DOI: 10.15790/cope.2026.22.3.115). This means housing costs move together with the household economy of the table set alone.
There are several reasons single-person households are increasing. In Italy, single-person households reached 36.8% of all households in 2021, up from 31.2% ten years earlier. Researchers who looked at that census cite delayed marriage, staying longer in parents' homes, delayed childbirth, higher divorce, living-apart-together romantic relationships, and longer lifespans as reasons, and view that the desire to live alone probably also plays a part (DOI: 10.71014/sieds.v77i2.185).
Therefore, a single number like single-person households can include older people, young people before marriage, divorced people, and those who chose to live alone, all together. Like the interview study we saw earlier, there are also people with a large holiday feast behind the table they set alone.
The number showing that single-person households have increased counts everyday tables, so we must ask separately how much of the holiday feast remains.
How Marriage and Divorce Are Counted
The news features marriages and divorces in numbers. The crude marriage rate is the number of marriages per 1,000 people in the population during a year. The divorce rate is the number of divorces counted per 1,000 people in the population, or per 1,000 married people, during a year. Because the number changes in the same country in the same year depending on what the denominator is, we first look at what the divorce rate in an article uses as its denominator.
When the entire population is used as the denominator, just a decrease in the number of people getting married can cause the divorce rate to fall alongside it.
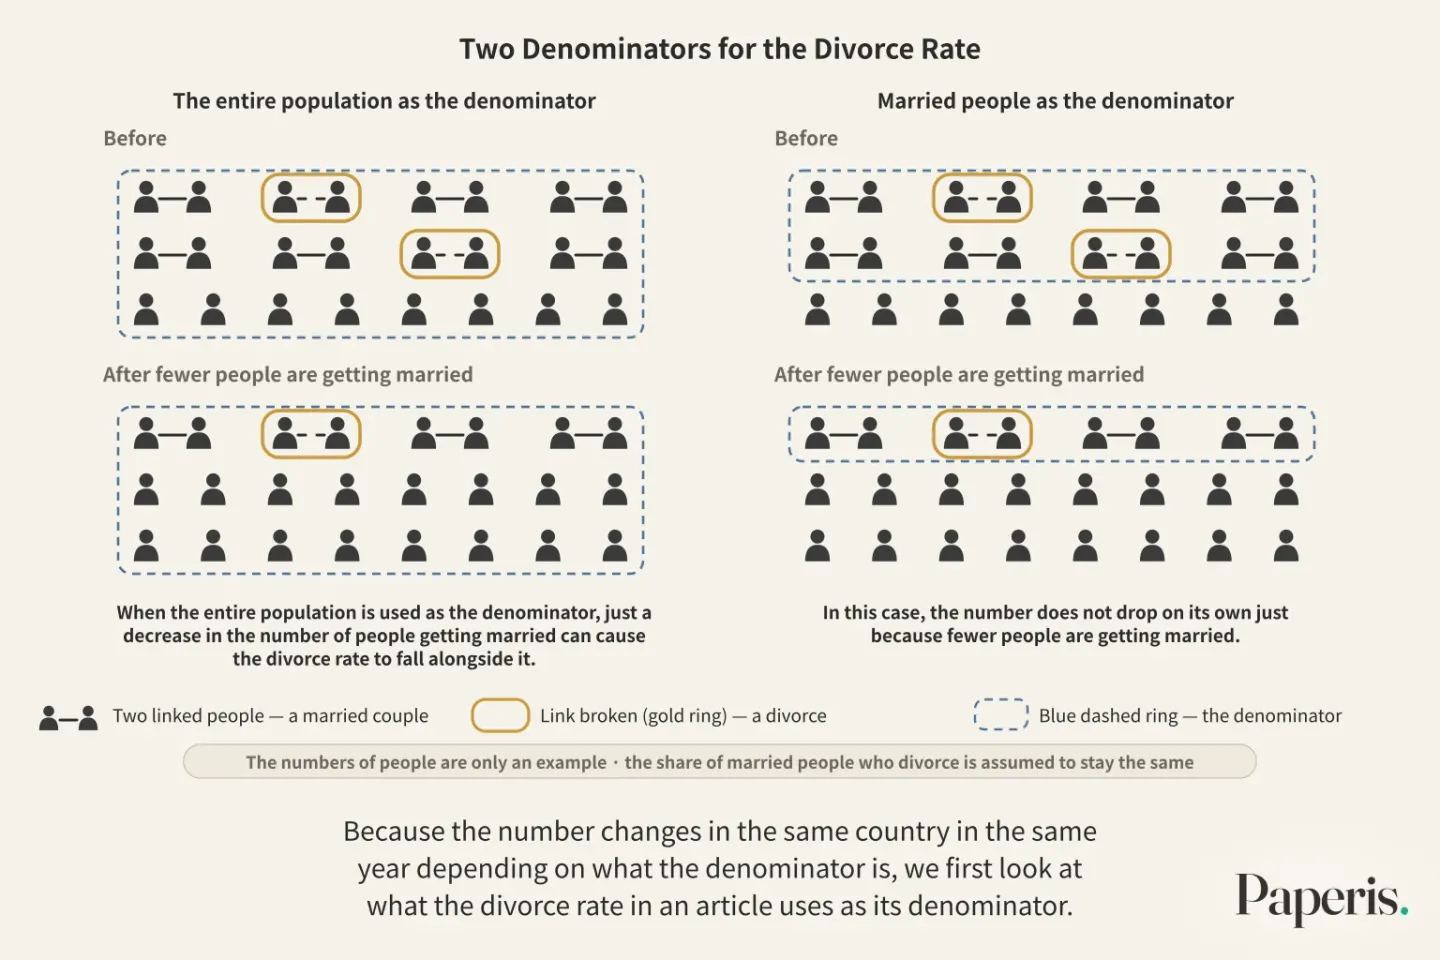
When married people are used as the denominator, the situation is different. In this case, the number does not drop on its own just because fewer people are getting married. In the U.S., the divorce rate counted this way was highest in 1980 and is now at about its level of around 1970, and textbooks cite the decrease in the number of people getting married itself and the rise in the age and education level of those who marry as plausible reasons (OpenStax Introduction Sociology 3e 14.3). That a decrease in marriage is cited as a reason even when using married people as the denominator can be read as meaning that when fewer people marry, who marries changes as well. However, the textbook does not spell out that pathway. Because the change in who marries and the changing circumstances within marriage are intertwined, it is difficult to isolate the cause with a single number.
Coming to the story of South Korea, Statistics Korea records show that there were approximately 115,000 divorces in Korea in 2014. The author of a legal study published in 2016 views that although the divorce rate had decreased slightly from 2005 up to that point, it merely fell because the number of people who do not marry or marry late increased, and divorces did not actually decrease. The abstract does not specify what this divorce rate was divided by (KCI ART002102325).
The path of living together outside of marriage has also widened. Cohabitation is two unmarried people living together in a romantic relationship. In the U.S., most first-time cohabiting romantic relationships start as cohabitation rather than marriage, but most cohabitations do not lead to marriage (DOI: 10.1093/oso/9780197655504.003.0003).
There is a similar trend in East Asia. In an analysis published in 2010, South Korea, Japan, Taiwan, Hong Kong, and Singapore strongly resembled Southern Europe in that marriage and parenthood were being delayed and cohabitation was increasing. However, cohabiting couples becoming parents was still very rare in these Asian societies (DOI: 10.1111/j.1728-4457.2010.00328.x).
Why marriage and childbirth are being delayed and cohabitation is increasing remains debated among scholars as well. The author of a review article examining delayed childbirth and increasing cohabitation together believes that trying to explain the trend of childbirth with a single cause misses the actual, complex reality where structural circumstances and shifts in mindset are intertwined. They also view that how widespread cohabitation becomes differs across countries depending on kinship traditions, including women's status, and how much individual autonomy is prioritized (DOI: 10.1186/s41118-020-00077-4). The story of declining childbirth continues in "Population — A House Divided into Floors by Age, and the People Who Move Up One Floor Each Year".
The Hands That Set and Clear the Table
Married women who worked spent an average of more than 100 minutes a day longer working than their husbands in 1999, according to data from Statistics Korea’s Time Use Survey. Here, "work" is the combined time spent on paid work and housework. In the same data, Korean men’s housework time was 23 to 25 minutes per day, which was about 5 to 10% of women’s levels (KCI ART000987742).
Housework is unpaid work done at home for family members, such as cooking, cleaning, and doing laundry. Caregiving is the work of looking after people who have difficulty living on their own, such as children, the elderly, and the sick. In welfare policy, caregiving is sometimes narrowed down to this definition of "looking after dependent people" and treated separately from housework (KCI ART001598531). In terms of a meal, setting and clearing the table is housework, and spoon-feeding a child sitting at the table is caregiving.
Caregiving leaves its mark on the caregivers themselves as well. Unpaid caregiving for elderly family members or close acquaintances can negatively affect the physical and mental health of the caregiver, and that impact was pronounced among women, married individuals, and those who provided heavy care for a long time. Because who takes on caregiving varies from person to person, making cause and effect difficult to disentangle, this conclusion comes from a systematic review that gathered only 15 studies that estimated causal effects (PMID 30395200).
Society's expectations are embedded in who sets the table. Gender roles are the shares that society expects men and women to take on and how they are expected to behave. Where do we learn those expectations? A sociology textbook covering American society lists the family as the primary place, and notes that schools, peers, and mass media repeatedly instill the same expectations (OpenStax Introduction Sociology 3e 12.2).
The double burden is carrying two shares of work by doing paid work while shouldering most of the housework and caregiving. A study comparing three explanations using 1999 data concluded that this double burden explanation best fits the reality of working married women. Neither the explanation that husbands share more housework when wives are employed, nor the explanation that things improve as generations change, was supported in that data (KCI ART000987742).
A 2014 study that used different subjects and measurement methods shows a slightly different picture. In time diaries of 858 couples with a preschool-first child, husbands in households where wives were employed shared housework and caregiving more evenly than husbands in single-earner households. However, more than half of the husbands in households with employed wives belonged to a group that took on a smaller share of housework and caregiving, while the rest were divided between a group that shared both much more evenly and a group that primarily took on child caregiving (DOI: 10.21321/jfr.22.3.47).
An entry in a family studies encyclopedia that does not specify a country cites time use surveys from 1965, 1975, and 1998, summarizing that in most heterosexual couple households, women did more housework and that the gap has narrowed little by little but still remains (DOI: 10.1002/9781119085621.wbefs188).
How things are measured also changes the numbers. If child care is counted only as actions like bathing and feeding a child, the time of fathers who participate heavily in indirect care—such as watching over a child while doing other things nearby—and the parenting time of employed mothers may be captured as less (DOI: 10.18341/wsr.2018.35.2.171).
Housework and caregiving rested more heavily on women in most of the data examined in this article, and there was no data showing that this gap had disappeared.
Looking at the Same Table Differently While Clearing It
Imagine, for example, that a dual-income couple is clearing the dinner table together. They are clearing the same dishes in the same kitchen, but the two may give different answers to the question, "Is our division of labor fair in our home?"
In family survey data from 1,404 couples, husbands saw the division of housework and caregiving as fairer than wives did, and that gap was largest in child care. In the same data, what lowered the sense of fairness was the household's structure. The greater the share of housework and working hours assigned to the wife, the more chores were handled solely by one person rather than shared by the couple, the longer the marriage lasted, and the greater the conflict between work and family, the lower the perception of fairness was. And the fairer they felt the division was, the greater their satisfaction with their spouse was (DOI: 10.16975/kjfsw.2024.71.1.143). Even among 858 couples who kept time diaries in 2014, satisfaction with the division of labor diverged widely between spouses (DOI: 10.21321/jfr.22.3.47).
The feeling of fairness is not determined solely by the actual division of labor. In a study looking at 622 couples, even among households where chores were divided mostly among wives, the degree to which they felt it was fair varied, and what mainly divided that feeling was the benchmark they compared themselves against, namely comparison with a reference group (DOI: 10.21478/family.37.2.202506.001).
Who actually does how much and how moves closely with working hours. In a study using 2014 data that examined 714 dual-income couples with preschool children, the shorter the husband's paid working hours, the higher the wife's income share, and the more the husband favored a fair division, the longer the husband's housework time was. Among the three factors, time explained it best, and the influences of income and attitudes were also partly confirmed but weaker than time. The authors also discuss the limitation that these factors do not always lead to an actually fair division of labor (DOI: 10.16975/kjfsw.2019..64.5). In the Longitudinal Survey on Women and Families from 2007 to 2020, cases where husbands worked 53 hours or more per week, were self-employed, or had preschool children were closely linked to a one-sided division of labor, and households where conservative gender-role attitudes overlapped with husbands' long working hours were also like that (DOI: 10.18284/jss.2026.08.45.2.41).
The shape of society outside the home also plays a role. In a study comparing 22 industrialized nations using 1994 data, the effect of time availability and egalitarian attitudes in making housework more evenly distributed was greater for women in gender-equal countries (DOI: 10.1177/000312240406900601).
The distance between attitudes and reality is also visible. In 2023, 9,055 women aged 19 to 64 in the Longitudinal Survey on Women and Families showed attitudes slightly closer to the egalitarian side regarding gender roles (DOI: 10.22626/jkfrma.2025.29.3.002). One study starts from the observation that even while society's gender-equality values grow, various forms of gender-based division of labor remain within the home (DOI: 10.21478/family.37.2.202506.001). Among dual-income women, those with egalitarian gender-role attitudes who lived in households where chores were distributed mainly among women showed higher depression, and the researchers interpret the gap between perceptions and reality as a burden on mental health (DOI: 10.21478/family.30.4.201812.004). Because this comes from panel data associations, it does not determine which direction the cause runs.
Because who sets the table is tied not just to thoughts, but to working hours and workplace conditions, thoughts and actual division of labor do not change at the same speed.
Who Gets Invited to the Big Table
280 college students in one region were asked to choose all the family types they consider to be a family from twenty options. The proportion choosing the nuclear family, made up of parents and children, was the highest. Types chosen as family by more than half included extended families, adoptive families, single-parent families, stepfamilies, unmarried mother families, childless couples, same-sex couple families, sisters or cousins living together, and elderly people living alone (DOI: 10.21321/jfr.23.3.3.).
Family diversity is the presence of multiple shapes of families together within one society. Each person accepts this to a different degree. In 2023, women in the Korean Longitudinal Survey of Women and Families showed a degree of acceptance for various family types slightly below the midpoint, and the older they were, the stronger their traditional views on marriage were (DOI: 10.22626/jkfrma.2025.29.3.002). In another study looking at 5,141 women, how much a person felt society accepts diverse families best explained their own level of acceptance (DOI: 10.16999/kasws.2026.57.1.5). Thoughts on who to invite to the holiday feast moved together with how much they felt society accepts them.
Institutions also sit above this question. The authors of one study diagnose that the nuclear family made of "a married couple and their children" still occupies the place of the "normal family" in people's minds, while other relationships are not fully recognized as families at social and institutional levels (DOI: 10.17328/kjcs.2022.30.2.004). How to legally enshrine the relationships of people living together without marrying was under discussion in Korea as of 2021, and issues remained starting from whether to fit various forms of relationships into a single institution (DOI: 10.22791/ewhagl.2021.13.3.006).
Even among scholars, eyes reading this change are divided. One side sees that family can no longer be understood as an institution, while the other sees that the breadth of family life widens without losing the character of an institution. The authors of a review article examining these two perspectives see that both rely on the same framework of 20th-century sociology and thus have limits in explaining the change, and they propose a different theoretical framework (DOI: 10.1111/jftr.12329).
The table metaphor also has limits. The size of the table only shows how many people sit at it, not which table is a better table. Just like children who live apart yet accompany their parents to the hospital, there are families that remain connected without sitting at the same table.
The mere fact that the shapes of family have branched out does not tell us whether the old shape was the right answer or whether family has lost its meaning now.
Where to Look Next
Why housework and care work are not captured in the numbers of the national economy continues in "GDP and the Business Cycle — The Last Receipt, and the Day No Receipt Records". Before reading two things that move together, like care and health, or division of labor and depression, as cause and effect, "If People Who Take It Live Longer, How Were They Different to Begin With? — Confounding" covers what to check. How what other people think intertwines with our own judgments can be seen in "The Social Mind — A Rope Pulled from Both Ends, the Hands We Don't See".
Birth rates and aging are covered in "Population — A House Divided into Floors by Age, and the People Who Move Up One Floor Each Year", and social institutions and socialization in "What Is Society? — A Path Worn by Many Feet, and the Steps That Choose It".
Source Papers
- "Introduction to Sociology 3e — 14.1 What Is Marriage? What Is a Family?" (2021) — OpenStax Introduction Sociology 3e 14.1 — The definition of family (typically bound by blood, marriage, cohabitation, or adoption to form an emotional bond and economic unit recognized by society), the perspective viewing marriage and family as institutions, the work of families from a functionalist view (raising and socializing children, often caring for aging parents), and the U.S. Census Bureau's definition of family excluding cohabiting couples.
- "Introduction to Sociology 3e — 14.2 Variations in Family Life" (2021) — OpenStax Introduction Sociology 3e 14.2 — The definition of the nuclear family (married parents and children) and viewing unmarried parents as a variation of the nuclear family, along with the definition of cohabitation.
- "Introduction to Sociology 3e — 14.3 Challenges Families Face" (2021) — OpenStax Introduction Sociology 3e 14.3 — The U.S. divorce rate (per 1,000 married people) declining after its peak in 1980 to around 1970 levels, with plausible factors including falling marriage rates and rising marriage age and educational attainment.
- "Introduction to Sociology 3e — 12.2 Gender and Gender Inequality" (2021) — OpenStax Introduction Sociology 3e 12.2 — Focusing on U.S. society, family is the first among the four agents of gender socialization (family, education, peers, mass media).
- "Are One-Person Households Also One-Person Families? - A Critical Review of the Non-Family Image of Unmarried One-Person Households -" (2024) — DOI: 10.20970/kasw.2024.76.2.001 — In-depth interviews with 12 unmarried one-person households. A significant number consider even nephews and nieces as family, served as primary caregivers for parents and supporters of sibling families during early adulthood, and the scope of family narrows to one person only from later life onwards.
- "A Study on Family Diversity Depicted in Korean TV Dramas" (2021) — DOI: 10.21478/family.33.4.202112.003 — A comparison between 124 main characters from 67 dramas in 2020 and the 2020 National Family Survey. The actual average household size is 2.3 people with two-generation households being the most common, whereas single-person households in dramas are centered around males, people in their 30s, and unmarried individuals, whereas over half of actual single-person households are aged 60 or older and have diverse marital statuses.
- "Second Demographic Transition" (2018) — DOI: 10.1002/9781405165518.wbeoss059.pub2 — The expectation at the end of the first demographic transition that households worldwide would converge into nuclear and couple-centered types.
- "Family Change in Global Perspective: How and Why Family Systems Change" (2019) — DOI: 10.1111/fare.12361 — Western family changes spreading to countries undergoing economic development, technological shifts, and changes in cultural beliefs, while traditional family institutions adapt in different ways.
- "Analysis of the Transition of Family Diversity Discourse Reflected in Home Economics Textbooks Across Curriculum Periods" (2026) — KCI ART003343165 — Earlier textbooks presented the nuclear family as a normative and ideal model emphasizing social order and national development functions, whereas later textbooks cover diverse families and the defining criterion shifts from structure to relationships (affection, care, communication).
- "Home alone, the one-person households at the Italian 2021 permanent census. Who are they? Where do they live?" (2023) — DOI: 10.71014/sieds.v77i2.185 — The average Italian household size went from 3.35 (1971) to 2.40 (2011) to 2.24 (2021), and the share of single-person households went from 31.2% to 36.8%, driven by later marriage, staying longer in the family of origin, delayed childbearing, divorce, living apart together, longer lifespans, and perhaps a desire for autonomy.
- "Cohabitation Versus Marriage" (2024) — DOI: 10.1093/oso/9780197655504.003.0003 — Most first cohabiting relationships in the U.S. start as cohabitation, most cohabitations do not lead to marriage, and the path to marriage varies by social class.
- "The Unfolding Story of the Second Demographic Transition" (2010) — DOI: 10.1111/j.1728-4457.2010.00328.x — Japan, South Korea, Hong Kong, Singapore, and Taiwan mirroring Southern Europe in delayed marriage and childbearing alongside rising cohabitation, but childbearing among cohabiting couples in Asia remaining extremely rare.
- "The second demographic transition, 1986–2020: sub-replacement fertility and rising cohabitation—a global update" (2020) — DOI: 10.1186/s41118-020-00077-4 — Review article. Single-factor explanations fail to capture the complex situation responding to structural and ideological influences, and cohabitation is spreading to all classes, with its spread depending on the expansion of kinship organization and individual autonomy.
- "An Empirical Study on the Double Work Burden of Employed Married Women: Verification of Cooperative Adaptation, Double Work Burden, and Adaptation System Hypotheses regarding Household Labor Division" (2005) — KCI ART000987742 — The 1999 Time Use Survey by Statistics Korea. Employed married women work over 100 minutes more per day on average than their husbands, and male household labor is 23 to 25 minutes, which is 5 to 10% of women's. The cooperative adaptation and lag hypotheses are not supported, and the double work burden hypothesis explains the findings best.
- "Gender and Household Labor" (2016) — DOI: 10.1002/9781119085621.wbefs188 — The definition of household labor (all unpaid labor done inside the home or for household members), with women bearing a greater share in most heterosexual couple households, showing some convergence between 1965, 1975, and 1998, but inequality remaining common across all family forms.
- "Institutionalization of Care Work and Differences Among Women" (2011) — KCI ART001598531 — Limiting care work in the welfare state to "activities caring for dependents" and separating it from household labor is useful for policy institutionalization.
- "The Impact of Informal Caregiving for Older Adults on the Health of Various Types of Caregivers: A Systematic Review." (2019) — PMID 30395200 — Systematic review (15 papers estimating causal effects). Unpaid caregiving for older adults has negative effects on the mental and physical health of caregivers, particularly appearing in women, married individuals, and intensive caregivers, with effect sizes varying across subgroups.
- "Related Factors by Type of Husband's Household Labor and Childcare Division and Couples' Satisfaction with Household Division: Comparison of Dual-Earner and Single-Earner Couples" (2017) — DOI: 10.21321/jfr.22.3.47 — 858 couples from the 2014 Time Use Survey. Dual-earner husbands share more evenly than single-earner husbands, but over half share around 10% or less; the husbands who shared the least were not the most dissatisfied, but their wives were deeply dissatisfied.
- "Concept and Measurement of Care Work Time: Focusing on Childcare Labor" (2018) — DOI: 10.18341/wsr.2018.35.2.171 — The 2014 Time Use Survey. Counting only direct care behaviors can underestimate the time fathers spend participating in indirect care and the parenting time of working mothers.
- "Couples' Perception of Fairness in the Division of Household Labor and Childcare, and Spouse Satisfaction" (2024) — DOI: 10.16975/kjfsw.2024.71.1.143 — 1,404 couples from the National Family Survey. Husbands perceive the division as fairer than wives do, the difference is largest in childcare, dual-earner husbands perceive the division as the fairest and dual-earner wives as the most unfair, and higher perceptions of fairness increase spouse satisfaction.
- "Typology and Influencing Factors of Couples' Division of Household Labor and Childcare: Focusing on the Actual State of Division and Perceptions of Fairness in Division" (2025) — DOI: 10.21478/family.37.2.202506.001 — Latent profile analysis of 622 couples. Even as social gender equality values increase, gendered divisions of labor within the home remain diverse, perceptions of fairness differ even when the division is similar, and working hours mainly determine the division type, while comparison with a reference group mainly determines fairness perceptions.
- "A Study on Household Labor Time and Division Among Dual-Earner Couples" (2019) — DOI: 10.16975/kjfsw.2019..64.5 — 714 dual-earner couples with preschool children from the 2014 Korea Labor and Income Panel Study. Time availability best explains household labor time and division, while the effects of relative resources and gender-role attitudes are limitedly verified.
- "Changes in the Division of Household Labor Among Dual-Earner Couples: Long-Term Trends and Characteristics During COVID-19" (2026) — DOI: 10.18284/jss.2026.08.45.2.41 — Waves 1–8 of the Longitudinal Survey of Women and Families (2007–2020). Husbands working 53 hours or more per week, self-employment, and having preschool children are closely associated with unequal divisions.
- "Macro-level Gender Inequality and the Division of Household Labor in 22 Countries" (2004) — DOI: 10.1177/000312240406900601 — 22 industrial countries from the 1994 ISSP. The equalizing effects of time availability and gender ideology are greater for women in more equal countries.
- "The Impact of Gender-Role Attitudes and Acceptance of Family Diversity on Korean Women's Views on Marriage" (2025) — DOI: 10.22626/jkfrma.2025.29.3.002 — 9,055 individuals aged 19–64 from the 2023 Longitudinal Survey of Women and Families. Gender-role attitudes are slightly higher than the median toward equality, acceptance of family diversity is slightly lower than the median, and age has the largest effect on views of marriage (older age associated with more traditional views).
- "The Division Gap of Household Labor Within Available Time and Women's Depression Among Dual-Earner Couples" (2018) — DOI: 10.21478/family.30.4.201812.004 — Waves 5 and 6 of the Longitudinal Survey of Women and Families. In female-centered divisions, more progressive gender-role attitudes are associated with higher depression, interpreted as the gap between perception and reality having a negative impact on mental health.
- "Factors Influencing College Students' Perceived Acceptance of Family Diversity" (2018) — DOI: 10.21321/jfr.23.3.3. — 280 four-year college students in one province. The proportion recognizing the traditional nuclear family as a family is highest among 20 family forms, along with a list of forms recognized as family by over 50%.
- "Factors Influencing Korean Women's Acceptance of Family Diversity" (2026) — DOI: 10.16999/kasws.2026.57.1.5 — 5,141 women from the Longitudinal Survey of Women and Families. Acceptance is relatively low, and perceptions of social acceptance of family diversity best explain individual acceptance.
- "A Basic Study for Developing a Family Diversity Acceptance Questionnaire" (2022) — DOI: 10.17328/kjcs.2022.30.2.004 — The author's diagnosis that the nuclear family of "married couples and their children" ideologically occupies the position of the "normal family" while deviant relationships are not fully recognized socially and institutionally, alongside the development of an acceptance questionnaire.
- "Review of Issues in Legal Responses to Guarantee Family Diversity: Focusing on the Institutionalization of Various Partnerships and Communal Relationships" (2021) — DOI: 10.22791/ewhagl.2021.13.3.006 — Discussions on legal responses to legal marriage and blood-based systems amid falling marriage rates and rising single-person households, with legislation for institutionalizing non-marital partnerships remaining incomplete in South Korea.
- "Theorizing Family Change: A Review and Reconceptualization" (2019) — DOI: 10.1111/jftr.12329 — Finding both the deinstitutionalization and diversification views of family change limited by relying on 20th-century social institution frameworks, and proposing a Weberian institutional logics approach.
- "A Comparative Legal Study on Individual Dignity and Divorce - Focusing on Supreme Court Precedent (2013Mu568) and Legislation in EU Countries from the Perspective of Articles 10 and 36(1) of the Constitution -" (2016) — KCI ART002102325 — Legal paper. Citing Statistics Korea, there were approximately 115,000 divorces in South Korea in 2014 (the abstract marks this with the person counter), and the author interprets that the slight decline in divorce rates since 2005 is merely a concomitant drop due to the rise in non-marriage and late marriage rather than a substantial decrease.
- "The Relationship Between Housing Cost Share and Life Satisfaction Among Young Single-Person Households: The Mediating Role of Consumption Expenditure Structure" (2026) — DOI: 10.15790/cope.2026.22.3.115 — 4,291 youth single-person households not living with parents from the 2024 Youth Life Survey. A larger share of housing costs is associated with a smaller share of food expenses (the largest relationship); while the total effect of housing cost share on life satisfaction was not significant, the negative indirect effect through the shares of communication and entertainment/culture expenses was significant.
Sources (29)
- Introduction to Sociology 3e — 14.1 What Is Marriage? What Is a Family?
- Introduction to Sociology 3e — 14.2 Variations in Family Life
- Introduction to Sociology 3e — 14.3 Challenges Families Face
- Introduction to Sociology 3e — 12.2 Gender and Gender Inequality
- 1인가구는 1인가족인가? - 비혼 1인가구의 비가족적 이미지에 대한 비판적 고찰DOI 10.20970/kasw.2024.76.2.001
- 국내 TV 드라마에 나타난 가족 다양성에 대한 연구DOI 10.21478/family.33.4.202112.003
- Second Demographic TransitionDOI 10.1002/9781405165518.wbeoss059.pub2
- Family Change in Global Perspective: How and Why Family Systems ChangeDOI 10.1111/fare.12361
- Home alone, the one-person households at the Italian 2021 permanent census. Who are they? Where do they live?DOI 10.71014/sieds.v77i2.185
- Cohabitation Versus MarriageDOI 10.1093/oso/9780197655504.003.0003
- The Unfolding Story of the Second Demographic TransitionDOI 10.1111/j.1728-4457.2010.00328.x
- The second demographic transition, 1986–2020: sub-replacement fertility and rising cohabitation—a global updateDOI 10.1186/s41118-020-00077-4
- Gender and Household LaborDOI 10.1002/9781119085621.wbefs188
- The Impact of Informal Caregiving for Older Adults on the Health of Various Types of Caregivers: A Systematic ReviewPMID 30395200
- 남편의 가사노동과 자녀돌봄 분담 유형별 관련요인 및 부부의 가사분담만족도: 맞벌이 부부와 비맞벌이 부부 비교DOI 10.21321/jfr.22.3.47
- 돌봄노동 시간 개념과 측정: 자녀 돌봄노동을 중심으로DOI 10.18341/wsr.2018.35.2.171
- 가사노동과 자녀돌봄의 분담에 대한 부부의 공정성 인식과 배우자 만족도DOI 10.16975/kjfsw.2024.71.1.143
- 부부의 가사노동과 자녀돌봄 분담의 유형화와 영향요인 : 분담 실태와 분담에 관한 공정성 인식을 중심으로DOI 10.21478/family.37.2.202506.001
- 맞벌이 부부의 가사노동 시간과 분담에 관한 연구DOI 10.16975/kjfsw.2019..64.5
- 맞벌이 부부의 가사노동 분담 변화: 장기 추이와 COVID-19 시기의 특성DOI 10.18284/jss.2026.08.45.2.41
- Macro-level Gender Inequality and the Division of Household Labor in 22 CountriesDOI 10.1177/000312240406900601
- 성역할 태도, 가족 다양성 수용이 한국 여성의 결혼관에 미치는 영향DOI 10.22626/jkfrma.2025.29.3.002
- 맞벌이 부부의 가용시간 내 가사노동의분담격차와 여성의 우울DOI 10.21478/family.30.4.201812.004
- 대학생이 인식하는 가족 다양성 수용도에 영향을 미치는 요인DOI 10.21321/jfr.23.3.3
- 한국 여성의 가족다양성 수용도에 영향을 미치는 요인DOI 10.16999/kasws.2026.57.1.5
- 가족다양성 수용도 질문지 개발을 위한 기초연구DOI 10.17328/kjcs.2022.30.2.004
- 가족다양성 보장을 위한 법제 대응에 있어 쟁점 고찰: 다양한 파트너십과 공동체 관계의 제도화 이슈를 중심으로DOI 10.22791/ewhagl.2021.13.3.006
- Theorizing Family Change: A Review and ReconceptualizationDOI 10.1111/jftr.12329
- 청년 1인 가구의 주거비 비중과 삶의 만족도의 관계: 소비지출구조의 매개역할DOI 10.15790/cope.2026.22.3.115