
Paperis Articles
Population — A House Divided into Floors by Age, and the People Who Move Up One Floor Each Year
What does a 'total fertility rate of 0.72' actually measure? Through which doors a population grows and shrinks, and why there are now fewer children and more older people.
Your field's papers, as audio
Pick your fields and journals — Paperis summarizes the key papers and turns them into audio. Listen on your commute.
Start Paperis free →Population — A House Divided into Floors by Age, and the People Who Move Up One Floor Each Year
The Number "0.72"
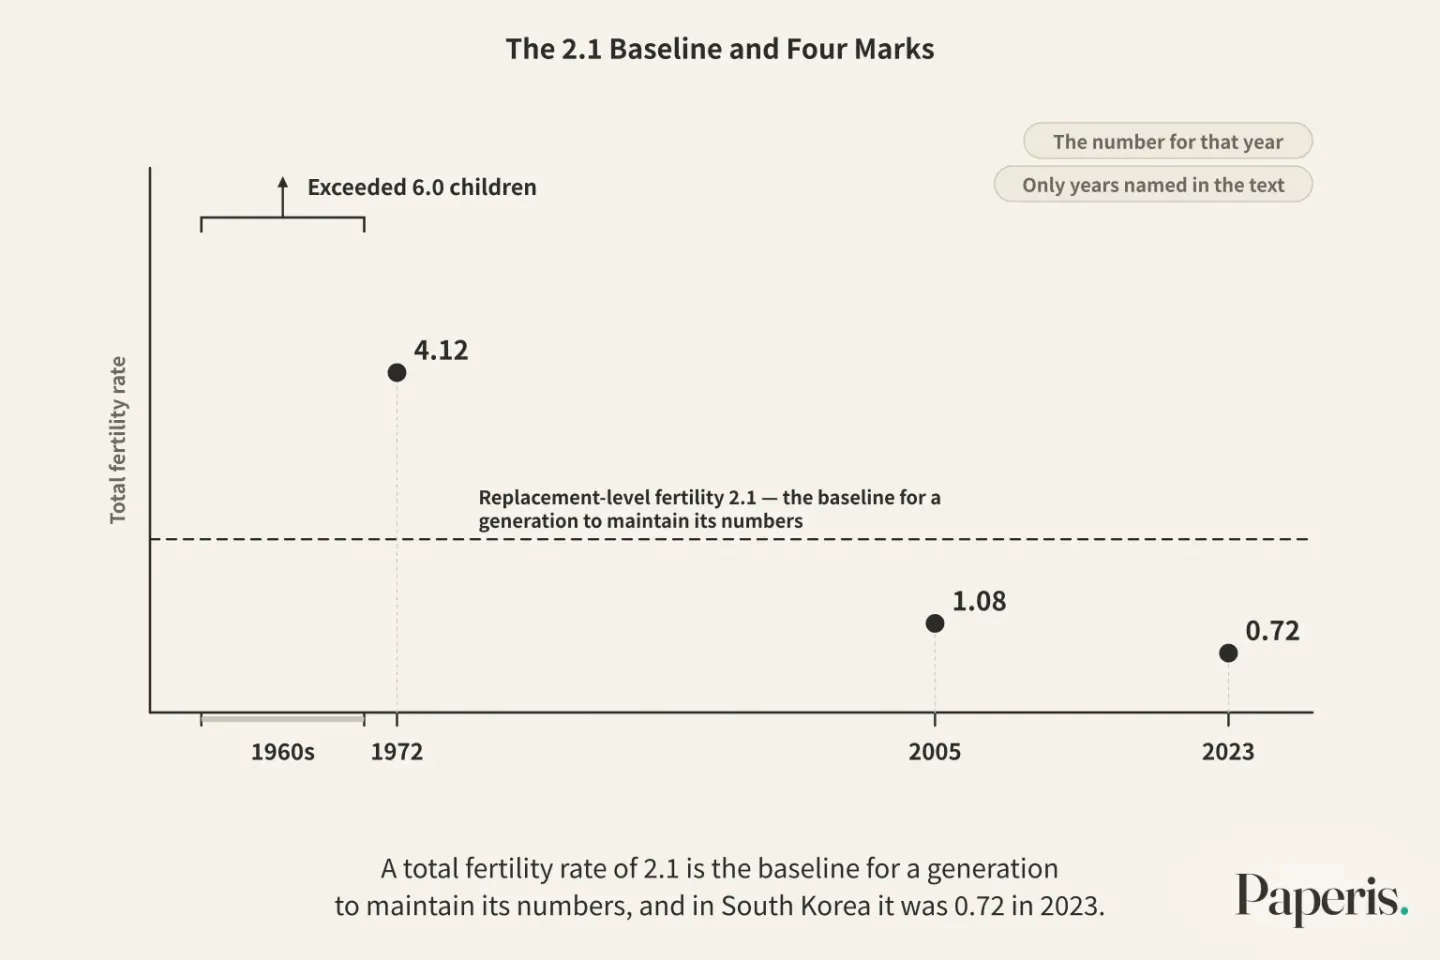
In 2023, South Korea's birth statistics recorded the number 0.72. This is the number of children a woman is expected to have over her lifetime, calculated for that year. Measured the same way in 1972, the value was 4.12 (DOI: 10.29274/ews.2024.36.3.67). Over half a century, the share per person moved from a little over four people to less than one.
The news attaches the word "low birth rate" to this number, and places stories like "there are more elderly people" and "the number of people is shrinking" alongside it. The three stories often appear together, but they are different things. This article traces how the number of people grows and shrinks, and why there are few children and many old people now. The examples are taken mostly from Korea, and the concepts apply to any society.
As a guide, we use a single house. It is a house where people of a country live, divided into floors by age. Newborn babies enter the 1st floor, and everyone moves up one floor higher each year according to their age. The people entering and leaving determine the number of people living in this house. In reality, people do not choose their floors, and living on an upper floor does not make one a burden. We use this picture only to follow the arrangement of population size and age.
Three Doors That Change the Number of People
There are two ways the number of people in this house increases. A baby is born and enters through the first-floor front door, or someone who used to live elsewhere moves in with their luggage through the side door. There are also two ways it decreases. They leave the world through the back door, or they move away to another place through the side door.
That is why there are three doors. The front door is birth, the back door is death, and the side door is people moving from one place to another. The academic study of populations also views these three as the foundation of population change (OpenStax Introduction Sociology 3e 20.1). "Low fertility" as we hear it in the news is a story about the front door, and "living longer" is a story about the back door opening later.
Populations change through only these three doors: birth, death, and migration.
The Number of Children a Person Has in a Lifetime
There is a simplest number for counting babies coming in through the front door. The crude birth rate is the number of babies born per 1,000 people in a given year (OpenStax Introduction Sociology 3e 20.1).
Looking only at the crude birth rate leads to confusing situations. In a year with an unusually large number of people of childbearing age, the number of babies per 1,000 people turns out high even if the number of children born per person is the same. Therefore, to be less swayed by the makeup of the population, a separately adjusted number per person is used.
The total fertility rate stitches together the age-specific fertility rates of that year to estimate the number of children a woman will have over her lifetime. The 0.72 from the first section is this number. It is not actually measured by following a single person through their entire life. It is a value calculated by sequentially stitching together the childbearing rates of 20-, 30-, and 40-year-old women in that year into one person's lifetime.
There is a baseline for reading this number. The replacement-level fertility is the total fertility rate required for one generation to pass on to the next in equal numbers to itself. It is usually denoted as 2.1 children (DOI: 10.18075/jcs..69.201901.189). If the total fertility rate stays below this line for a long time, the population decreases with each generation, excluding migration in and out.
Based on a chapter from a book published in 2017, nearly half of the world's population lives in regions below this line. Low fertility is no longer just a phenomenon of wealthy Western countries, and middle-income countries like China, Brazil, Iran, and Turkey have joined that list (DOI: 10.1093/oso/9780198813422.003.0007).
South Korea's total fertility rate exceeded 6.0 children in the 1960s, and shifted to low fertility in less than 30 years. In 2005, it was 1.08 (KCI ART001312631). Since 2002, it has been below 1.3 for 21 consecutive years (DOI: 10.2139/ssrn.4725518), and the period spent staying below 1.3 is the longest among OECD countries (DOI: 10.1215/00703370-10585316). The 0.72 in 2023 is a little over one-third of the 2.1 baseline.
A total fertility rate of 2.1 is the baseline for a generation to maintain its numbers, and in South Korea it was 0.72 in 2023.
The Number for That Year, The Number for a Lifetime
The total fertility rate is a number for that year. That is why, while the age at which people have children is getting later, it can appear lower than the number for a lifetime. For example, even if the same people have two children each just as before, if they postpone having them from around age thirty to around age thirty-five, for a few years in between, it gets captured as if the children born that year have decreased.
When Europe remeasured with total fertility rates adjusted to filter out this effect, all 27 countries analyzed between 1995 and 2000 exceeded 1.4. The researchers viewed this as readable as a temporary result caused by the rising age of becoming a mother, yet noted that large differences between countries and regions remained even after filtering out that effect (DOI: 10.1111/j.1728-4457.2004.010_1.x).
In South Korea, analyses follow that it is not merely getting later. In a study tracking Korean women born from before the 1960s to those born in the 1980s by grouping them by birth year, the main force that lowered the fertility rate changed from generation to generation. It shifted from married women having children later and fewer, to fewer women marrying, and finally, to an increasing proportion of women who do not have children even if they marry (DOI: 10.1215/00703370-10585316). Another domestic study that looked at the long-term trends of the total fertility rate by birth year also views that the lifetime number by generation has declined alongside the number for that year. The postponed childbirth was not made up for later, and the increase in women who did not have children accounts for a substantial share in the decline of recent generations. This study noted that, unlike in Europe, it seems difficult to expect in South Korea a rebound where postponed childbirth is made up for (DOI: 10.15709/hswr.2020.40.3.534).
There is also a way to measure the lifetime number separately. Completed fertility rate is the average number of children actually born over a lifetime by women who have passed their childbearing years. A domestic study that estimated this value using 2015 and 2020 population census samples estimates that the lifetime fertility of women who have already passed their childbearing years is likely at the level of 1.4 to 1.6 children, and viewed that it is difficult to validly read actual childbirth with the total fertility rate alone (DOI: 10.33900/KAPS.2023.32.4.8). However, this value belongs to an earlier generation, not the generation currently having children.
The total fertility rate is a number for that year so it can appear low while childbirth is being postponed, but in South Korea, the lifetime number by generation has also gone down together.
From an Era of Many Births and Many Departures
Childbearing in the era of high births was not endlessly high, either. Fertility in pre-modern societies was high, but due to late marriage or the custom of prolonged breastfeeding, it stayed at a moderate level quite a bit lower than the maximum possible number of children a person could bear (DOI: 10.30541/v23i4pp.531-552).
In South Korea, the total fertility rate exceeded 6.0 children in the 1960s (KCI ART001312631).
There are also numbers for the back door. The mortality rate is the number of people who pass away per 1,000 population in a given year (OpenStax Introduction Sociology 3e 20.1). How long people live is looked at through a different number. Life expectancy is an estimate of how many years a newborn is expected to live on average from then on (OpenStax Introduction Sociology 3e 13.1). To put it in terms of a house, it is about which floor a person who enters the first floor climbs up to and stays on, on average.
In a study dividing South Korea's changes in life expectancy from 1970 to 2018 by age, before the 1990s when the mortality level was high, drops in infant and young child deaths played a major role in increasing life expectancy. After the mortality level improved, drops in deaths among middle-aged and older adults became important (DOI: 10.22886/jkos.2020.25.3.1). It is the sequence where people who used to leave early on the lower floors decreased, and then people on the upper floors stayed longer.
The demographic transition is the shift in which a society moves from a state of "high births and high deaths" to a state of "low births and low deaths" (DOI: 10.1093/oso/9780195121582.003.0016). There is an order to it. As agricultural technology and medicine improve and hygiene gets better, deaths decrease first. Meanwhile, fertility remains the same for a while, causing the population to swell rapidly. Next, as parents realize they can raise the children they want even by having fewer, fertility declines, and the spread of contraception helps this trend. Eventually, the rate of population growth settles at a new level (DOI: 10.1093/oso/9780195121582.003.0016). The theory dividing the transition into four stages views that the population could even shrink in the final stage (OpenStax Introduction Sociology 3e 20.1).
There are various explanations for why parents come to have fewer children. One of them is the explanation that as the economy develops, the value of what is given up to raise children grows. The value of the best alternative given up because of a certain choice is called the opportunity cost. In a study looking at South Korean data from 1970 to 2022, the higher the per capita income, the lower the fertility rate. Mortality results varied depending on the estimation method, but in estimations handling the problem of tangled cause and effect, lower mortality was linked to lower fertility as well. The author views this as a result fitting the explanation that investment per child grows rather than the number of children (DOI: 10.30776/JES.44.2.3).
There is also an opposing observation. A European transition study introduced in a 1984 paper revealed that fertility rates did not link simply to education levels, the proportion living in cities, or infant mortality, and that culture—such as customs or religious traditions in regions speaking the same language—could be important. Even so, it concludes that once modernization proceeds sufficiently, societies appear to shift to low fertility and low mortality (DOI: 10.30541/v23i4pp.531-552).
Where the transition stops remains an open question. According to demographic transition theory, fertility rates should settle around the replacement-level fertility. However, as the number of countries falling below that increases, forecasts are divided on whether ultra-low fertility is a passing phenomenon or will continue further (DOI: 10.1093/oso/9780198813422.003.0007).
While deaths decrease first and births follow suit, the population swells significantly before slowing down again.
The Number of People Living on Each Floor Changes
Japan's transition was very short and rapid. One domestic study notes that in a very short time, Japan moved from a state of high birth and high death rates, through a state of high birth and low death rates, to a state of low birth and low death rates. Amidst this, the large generation born during the period when the population swelled significantly crossed the age of 65, causing the proportion of older adults to rise sharply. With this generation passing away overlapping with low fertility that continued for decades after the war, the population is also declining. Japan's population began to decrease, peaking in 2008, and over the following 9 years, about 1.31 million people decreased (KCI ART002295962).
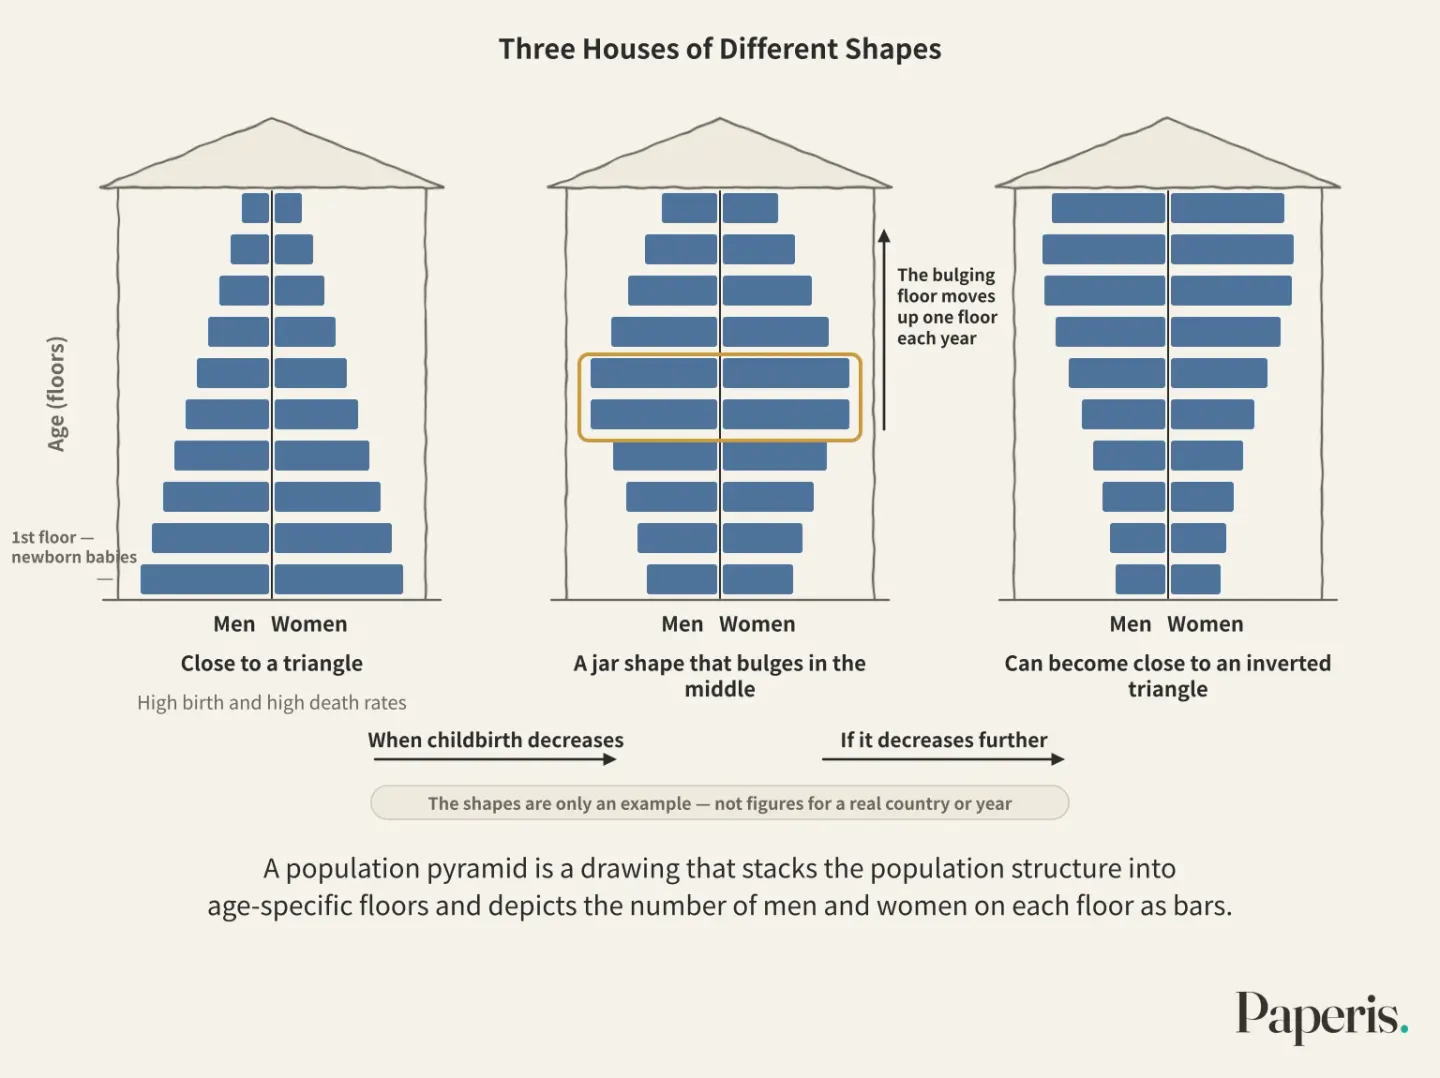
Metaphorically speaking, it is like a single floor where an unusually large number of people gathered moving up one floor each year. When that floor reaches the upper floors, the upper floors become crowded, and when the people on that floor leave the house with few children entering the first floor, the number of people in the entire house decreases.
Population structure is the composition of a population divided by age and sex. A population pyramid is a drawing that stacks the population structure into age-specific floors and depicts the number of men and women on each floor as bars (OpenStax Introduction Sociology 3e 20.1). The drawing of a society with high birth and high death rates is close to a triangle that is wide at the bottom and narrow at the top. When childbirth decreases, the lower floors narrow into a jar shape that bulges in the middle, and if it decreases further, it can become close to an inverted triangle where the top is wider than the bottom.
Population aging is an increase in the proportion of older adults within the entire population. Looking at the country as a whole, there are two paths to aging. Either fewer children enter the first floor, or people on the upper floors stay longer.
In Korea, the first path was larger. One report that divided data from the past 50 years estimated the contribution to aging as 70% from low fertility and 30% from increased life expectancy. Korea's aging speed is also among the fastest in the world (DOI: 10.2139/ssrn.4725518). A domestic study analyzing the period since the 1970s using three different methods also reached the same conclusion that the decrease in fertility rate was the main factor, although the methods differed. The same study notes that recently, as the fluctuation range of fertility rates has decreased and older-age mortality has improved, the share of living longer has an increasingly large impact, and in the future, the decrease in older-age mortality is likely to drive population aging (DOI: 10.15709/hswr.2023.43.1.50).
Korea's aging over the past half-century was mainly caused by fewer children entering the first floor, and the share of living longer is likely to grow in the future.
The Middle Floor and the Floors Beside It
The dependency ratio is the number of children, older adults, and others outside the workforce compared to the number of people who work (OpenStax Introduction Sociology 3e 13.1). This ratio is sometimes counted by whether people actually work, and sometimes by whether they are of working age (OpenStax Introduction Sociology 3e 13.1) (DOI: 10.2139/ssrn.893608). If you think of it like a house, it is how many people on the floors below and above there are for each person on the middle floor.
When we look at the dependency ratio counted by age, a sequence appears when births start to drop. For the first few decades, the children on the first floor decrease while the older adults on the top floor are not yet numerous, so the ratio of other ages compared to working-age people drops. These decades when the working-age population is thick are called the "demographic dividend." A 2006 working paper explains the rising old-age dependency ratio across multiple countries as this dividend period passing (DOI: 10.2139/ssrn.893608).
Here, the house metaphor misses something. The drawing shows only floor numbers—in other words, age. If generations have become healthier even at the same age, we can view the threshold of being an "older adult" differently. In a domestic study that recalculated age based on remaining life expectancy, accounting for improved health levels, population aging was progressing more slowly than in common discussions, and the proportion of older adults came out lower than when measured by calendar age (DOI: 10.22886/jkos.2022.27.2.22). The people on the top floor also work, care for others, and give and take. The dependency ratio is merely a ratio counted by age and employment status, and it does not capture everything that passes back and forth between people.
Because the dependency ratio is a ratio counted by age and employment status, healthier old age and what passes between people are not fully captured in this number.
Why Are Fewer Babies Born? — Several Branches of Answers
There is a working paper survey that asked 2,000 unmarried people aged 25 to 39 about their intentions to marry and have children. When the respondents were randomly divided and only one group was asked to think about the cost of housing first, that group showed a statistically significant drop in their intention to marry and their desired number of children. No such effect was found in the group that was asked to think about education and medical expenses first (DOI: 10.2139/ssrn.4655594). At least in this experiment, the results varied depending on the type of cost.
Research asking about the causes of low birth rates is divided into several branches like this. If you hold onto just one branch, the other branches are obscured.
The first branch is marriage. The decline in the marriage rate in South Korea is cited as a major factor contributing to the extremely low fertility rate (DOI: 10.2139/ssrn.4725518). In the generational analysis we saw earlier as well, the decrease in women getting married was one step in the process. The shapes of marriage and family are covered in "Family — The Table We Share Every Night, and the Big Table We Set for the Holidays".
The second branch is jobs. According to data from the Korea Labor and Income Panel from 2014 to 2023, households of non-regular workers and small-business employees had fewer children each year. As of 2023, non-regular worker households had 0.36 children, while regular worker households had 1.09. When comparing after adjusting for other conditions, that gap shrank to 14.1%, but it remained low (DOI: 10.35526/srd.2025.57.3.006). In the results viewing the previous survey through regression analysis, the intention to marry was high among the employed, regular workers, public institution workers, and public officials (DOI: 10.2139/ssrn.4655594). However, in the aforementioned completed fertility rate study, the number of children born over a lifetime by generations that had already passed childbearing age did not differ significantly by income, education, or economic activity status, and was very strongly tied to the timing of first marriage (DOI: 10.33900/KAPS.2023.32.4.8).
The third branch is housing. In nationwide city, county, and district data from 2012 to 2023, the higher the apartment sales and jeonse rental prices, the lower the total fertility rate (DOI: 10.22773/RPR.2026.37.1.1). Yet in another study looking at 16 metropolitan city and provincial data from 2005 to 2022, the higher the apartment sales price index, the higher the total fertility rate turned out to be (DOI: 10.22743/kwr.2024.6.6.931). Depending on how finely regions are divided, which year is examined, and what is considered together, the answers to the same question diverge.
The fourth branch is balancing work and caregiving. In a study tracking the birth of second children in South Korea, a woman's eligibility to use parental leave and the share of housework taken over by her husband each increased the likelihood of having a second child. The researchers interpreted these two as interchangeable supports that ease the same work-family burden (DOI: 10.1093/sf/soz159). The effects of leave systems vary across studies. In South Korean 16 metropolitan city and provincial data from 2005 to 2022, men's parental leave without guaranteed income was instead linked to a decrease in the total fertility rate (DOI: 10.22743/kwr.2024.6.6.931), whereas in OECD 32-country data from 1990 to 2017, the duration of maternity leave had no effect, and the duration of parental leave was positive only in some regional countries. In the same OECD data, the wider the gender gap in workplace economic participation rates and wages, the lower the fertility rate (KCI ART002462422).
The fifth branch is values and competition. There is an analysis suggesting that South Korea's strong family-centered culture and tradition of valuing education drive up the cost per child, while rigid gender role divisions keep the opportunity cost of having children high. This analysis views a large share of the difference between "somewhat low" and "extremely low" fertility rates as stemming from cultural patterns outside of family policy (DOI: 10.1111/j.1475-6781.2008.00116.x). Conversely, some argue that the rapid drop in South Korea's fertility rate is not a result of so-called changing values, but rather the manifestation of various social structural problems (KCI ART001312631). In the regression analysis results of the previous survey, the more respondents accepted traditional values such as the necessity of having a son, the higher their intentions to marry and have children were, while the greater their sense of obligation to financially support their children was, the lower those intentions were (DOI: 10.2139/ssrn.4655594). There is also a working paper argument that under ranking-order competition, concentrating resources on one or two children is rewarded over having many children (DOI: 10.2139/ssrn.7188704).
These branches do not operate in isolation. The aforementioned 2024 report cited "competitive pressure" and "anxiety" surrounding jobs, housing, and child-rearing as the most important factors (DOI: 10.2139/ssrn.4725518). Domestic research reviewing European and Japanese cases together also concludes that South Korea's ultra-low fertility rate is a problem driven by a complex interplay of economic, socio-cultural, and policy-institutional factors (KCI ART003045617). Because many of these are studies showing a relationship where two things move together, whether one is the cause of the other must be examined separately. The aforementioned survey is a rare case in that regard, as it was an experiment that randomly divided groups only on the part about making them think about housing costs.
Such studies, showing that results change depending on conditions, demonstrate that population trends move alongside the living conditions of people. Even if demographic transition sets the broad direction, how much it drops within that varies by society.
The causes of the low birth rate do not converge into one, and research looks at marriage, jobs, housing, work and caregiving, and values and competition together.
People Coming and Going Through the Side Door
Migration is when a person permanently moves into or out of a region (OpenStax Introduction Sociology 3e 20.1). While births and deaths happen within that society, migration is an exchange with the outside.
A study on demographic transition notes that if we assume no exchange of people with the outside, we can guess the transition a country has gone through and its plausible future based solely on its population growth trends (DOI: 10.1093/oso/9780198286592.003.0003). Conversely, in places where the side door is wide open, it becomes difficult to read the future looking only at births and deaths.
Even with the same migration, movement between regions within a country does not change the total national count, only the distribution between regions. There is an analysis that the large population decline in non-metropolitan areas of South Korea is driven not only by recent low birth rates, but in large part by people moving to the capital area (DOI: 10.14251/jscm.2022.6.13). Movement between regions continues in "Cities and Regions — Gathered Around the Fire, Seats Beyond Its Light".
Because migration is the third door through which people are exchanged with the outside, it is difficult to fully read the future of a population using only births and deaths.
Reading a News Sentence
Let us read a sentence like this using what we have learned. "Total fertility rate 0.72 last year… Aging accelerates further."
The "total fertility rate" stitches together the childbirths at each age in that given year across a person's lifetime. Compared to the benchmark of 2.1, it is a little over one-third. Because it is a yearly figure, it can appear low while childbearing is simply being delayed, but in Korea, we cannot view it as solely a matter of delay. There are concurrent analyses showing that lifetime numbers per generation have also dropped because fewer people are marrying, and more people choose not to have children even when they do marry. How many children the current generation will have over their lifetimes must be reassessed later using the completed fertility rate after that generation has passed all childbearing ages.
"Aging accelerates further" means the proportion of older adults is growing. Korea's aging over the past half-century has been driven primarily by a decrease in children entering the bottom floor, and in the future, the share living to old age is likely to grow larger. If we redefine the threshold of old age based on health levels, that pace can sometimes look slower than in common discussions.
We cannot pinpoint causes from this single sentence alone. Marriage, jobs, housing, work and care, values, and competition are all discussed together, and even for the same housing prices or parental leave policies, results diverge depending on the study. Just how much the population will actually shrink is determined not only by births, but also by deaths and side-door migration together.
Where to Look Further
Marriage, households, and the shapes of care continue in "Family — The Table We Share Every Night, and the Big Table We Set for the Holidays". The terms of capital concentration and regional extinction are covered in "Cities and Regions — Gathered Around the Fire, Seats Beyond Its Light", and the weave of income and class in "Inequality and Social Stratification — This Month's Allowance, the Piggy Bank Handed Down".
When reading research on causes, whether a relationship like "birth rates are lower where housing prices are high" is truly a cause can be examined in "If People Who Take It Live Longer, How Were They Different to Begin With? — Confounding". The difference between experiments that randomly divide groups and designs that ask about causes using only observational data continues into "Asking About Causes Without an Experiment — Natural Experiments and Four Designs". The cost of what is given up to raise a child is covered by "Scarcity and Opportunity Cost: What Do You Give Up When You Choose?", and how jobs are measured by "Unemployment and Employment — Those in Line, Those Who Left It".
Source Papers
- "Introduction to Sociology 3e — 20.1 Demography and Population" (2021) — OpenStax Introduction Sociology 3e 20.1 — Births, deaths, and migration are the three drivers of population change, crude birth rate and crude death rate (per 1,000 people per year), in-migration and out-migration (permanent residence), population pyramids (charts of age and sex distribution), and the possibility that population may shrink in the final stage of the four-stage demographic transition theory.
- "Introduction to Sociology 3e — 13.1 Who Are the Elderly? Aging in Society" (2021) — OpenStax Introduction Sociology 3e 13.1 — Definitions of life expectancy (how many years a person born today is expected to live on average) and dependency ratio (population outside the workforce — children, people with disabilities, older adults — relative to the workforce population).
- "An Analysis of the Causes of Low Fertility: Focusing on Economic Factors" (2024) — DOI: 10.29274/ews.2024.36.3.67 — South Korea's total fertility rate fell from 4.12 children in 1972 to 0.72 in 2023.
- "The Causes of Low Fertility in Korean Society: A Critical Review of Non-Intervention in the Private Sphere" (2007) — KCI ART001312631 — The fertility rate, which exceeded 6.0 in the 1960s, plummeted to 1.08 by 2005 in less than three decades, arguing that this steep decline is the result of social structural problems rather than changing values.
- "Lowest-low Fertility and Super-aged Society: Causes and Impacts of the Extreme Population Structure, and Policy Options" (2024) — DOI: 10.2139/ssrn.4725518 — Report (SSRN). Below 1.3 for 21 consecutive years since 2002, falling marriage rates as a major contributor, aging contributing 70% to low fertility and life expectancy 30%, aging pace among the highest globally, identifying competitive pressures and anxieties around employment, housing, and childrearing as the most critical factors.
- "Later, Fewer, None? Recent Trends in Cohort Fertility in South Korea" (2023) — DOI: 10.1215/00703370-10585316 — Twenty years below 1.3 is the longest in the OECD, with the primary driver of low fertility shifting across birth cohorts from "married women having children later and fewer" to "declining marriage" to "remaining childless even when married."
- "Future Fertility in Low Fertility Countries" (2017) — DOI: 10.1093/oso/9780198813422.003.0007 — Book chapter. Nearly half of the global population lives in sub-replacement-level regions, spreading to middle-income countries, with an open question of whether it will stabilize at replacement level or drop further below.
- "Is Lowest‐Low Fertility in Europe Explained by the Postponement of Childbearing?" (2004) — DOI: 10.1111/j.1728-4457.2004.010_1.x — TFR adjusted for the tempo (childbearing postponement) effect exceeds 1.4 in all 27 countries, which can be interpreted as a temporary outcome, though regional differences remain.
- "A Reconsideration of South Korea's Fertility Rate: Focusing on the Limitations of the Total Fertility Rate Indicator and the Analysis of Completed Fertility Rate" (2023) — DOI: 10.33900/KAPS.2023.32.4.8 — Completed fertility estimated at 1.4 to 1.6 children using 2015 and 2020 census samples, with the author assessing that valid conclusions are difficult to draw from total fertility rate; completed fertility shows little variation across income, education, and economic activity status while correlating strongly with age at first marriage.
- "Demographic Transition and Economic Development" (1998) — DOI: 10.1093/oso/9780195121582.003.0016 — Book chapter. Definition of demographic transition, mortality decline coming first and fertility decline following, and the role of contraception.
- "An Analysis of the Long-term Determinants of Fertility Rates" (2026) — DOI: 10.30776/JES.44.2.3 — South Korean time series from 1970 to 2022. Per capita income is negative (-) on fertility, and mortality is positive (+) in instrumental variable estimation, consistent with explanations favoring investment in child quality over quantity.
- "The Demographic Transition" (1984) — DOI: 10.30541/v23i4pp.531-552 — Pre-modern fertility was kept below maximum levels by custom at a moderate level, and European transition studies introduced show no simple link between fertility and education, urbanization, or infant mortality, making cultural factors like language and religion important, yet sufficient modernization invariably brought about transition.
- "Japan's Crisis of Low Fertility, Population Aging, and Population Decline: Population Changes over 150 Years of Modernity from the Perspective of Demographic Transition Theory" (2017) — KCI ART002295962 — Japan's rapid shift from high birth and death rates to high birth and low death rates to low birth and low death rates, population decline driven by the aging and death of large birth cohorts, dropping by about 1.31 million people over nine years following its peak in 2008.
- "Demographic Factor Analysis of Population Aging" (2023) — DOI: 10.15709/hswr.2023.43.1.50 — Across all three methods, fertility decline has been the primary driver of population aging over the past 50 years, with improvements in old-age mortality recently growing in impact and likely to lead going forward.
- "Population Aging" (2006) — DOI: 10.2139/ssrn.893608 — Working paper. Aging is primarily the result of past fertility declines, which first created decades of low dependency ratios (the demographic dividend), while rising old-age dependency ratios reflect the passing of that dividend, calculated relative to working-age adults.
- "Educational Attainment and Population Aging Indicators (1995–2020): Prospective Age Approach" (2022) — DOI: 10.22886/jkos.2022.27.2.22 — Viewed through prospective age standards that account for improving health levels, population aging proceeds more slowly than in standard discussions, and the proportion of older adults is lower than chronological age indicates.
- "Economic and Non-economic Determinants of the Lowest-Low Fertility Rate in Korea: An Analysis of Survey Experiments" (2023) — DOI: 10.2139/ssrn.4655594 — Working paper. Survey of 2,000 childless adults aged 25–39 (1,000 unmarried, 1,000 childless married). Only the housing cost priming portion was a randomized experiment (lowered marriage intent and desired number of children, while education and medical cost effects were not confirmed), with the rest relying on basic statistics and regression analysis (employment stability increased marriage intent, and acceptance of patriarchal values increased the sense of obligation to provide financial support to children).
- "Fertility Determinants by Employment Type and Firm Size" (2025) — DOI: 10.35526/srd.2025.57.3.006 — Korea Labor and Income Panel Study 2014–2023, showing lower child counts in non-regular worker and small-firm households (0.36 children for non-regular workers versus 1.09 for regular workers in 2023), with non-regular workers 14.1% lower after controlling for other factors.
- "The Impact of Housing Prices on the Total Fertility Rate: Focusing on Si-Gun-Gu Level Analysis" (2026) — DOI: 10.22773/RPR.2026.37.1.1 — Si-gun-gu panel from 2012 to 2023, showing that apartment purchase and jeonse prices significantly lower the total fertility rate.
- "Factors Influencing the Total Fertility Rate: Focusing on Values, Economic, and Gender Equality Factors" (2024) — DOI: 10.22743/kwr.2024.6.6.931 — A panel of 16 metropolitan cities and provinces from 2005 to 2022 showing a positive relationship where higher apartment sales price indices correspond to higher total fertility rates, while paternal childcare leave lacking guaranteed income is linked to a decrease in total fertility rate.
- "Lowest-Low Fertility in South Korea: Policy and Domestic Labor Supports and the Transition to Second Birth" (2020) — DOI: 10.1093/sf/soz159 — Paternal childcare leave eligibility and husbands sharing domestic labor each raise the likelihood of a second birth, with the husband's contribution operating effectively only when access to leave is restricted (substitution relationship).
- "Fertility Determinants in OECD Countries: An Analysis of Family Policies and Gender Gaps in the Labor Market" (2019) — KCI ART002462422 — 32 OECD countries from 1990 to 2017, showing that wider gender gaps in economic activity participation and wages lead to lower fertility rates, with maternity leave duration having no significant effect and parental leave duration being positive only in West, South, and East Europe.
- "Korea's Strong Familism and Lowest‐Low Fertility" (2008) — DOI: 10.1111/j.1475-6781.2008.00116.x — Strong familism and emphasis on education raise the direct costs of children, rigid gender role divisions raise the opportunity cost of childbearing, and a large share stems from cultural patterns outside family policy.
- "The Confucian Fertility Paradox: Education Competition and Ultra-Low Fertility in East Asia" (2026) — DOI: 10.2139/ssrn.7188704 — Working paper (NBER). Argues that single-ranking competition rewards concentrated investment in one or two children, producing low fertility.
- "Key Causes of and Policy Directions for the Ultra-Low Fertility Phenomenon: Focusing on European and Japanese Cases" (2023) — KCI ART003045617 — South Korea's ultra-low fertility is a problem driven by a complex interplay of economic, socio-cultural, and policy-institutional factors.
- "An Empirical Study for Implications to Respond the Crisis of Local Population Decline in South Korea" (2022) — DOI: 10.14251/jscm.2022.6.13 — Population decline in non-capital regions is driven not only by recent low fertility but also by migration to the capital area.
- "Demographic Transition: The Current Position" (1992) — DOI: 10.1093/oso/9780198286592.003.0003 — Book chapter. Transition stages in a country's growth path can only be inferred when there is no migration exchange with the outside.
- "A Study on Policy Changes Surrounding the Turning Point in Japan's Total Fertility Rate Rise" (2019) — DOI: 10.18075/jcs..69.201901.189 — Notes population replacement level as 2.1 children (policy review section not cited).
- "Visualization of South Korean Mortality Improvements and Age-Specific Contribution Analysis to Life Expectancy Gains" (2020) — DOI: 10.22886/jkos.2020.25.3.1 — Decomposition of South Korean life expectancy changes from 1970 to 2018, showing that improvements in infant mortality drove gains before the 1990s, while middle-aged and older adult mortality improvements drove gains thereafter.
- "Long-term Trend Analysis of Domestic Cohort Total Fertility Rates" (2020) — DOI: 10.15709/hswr.2020.40.3.534 — Both period and cohort TFRs have fallen, postponed childbearing has failed to materialize, a substantial share of recent declines is driven by an increase in childless women, and a European-style rebound appears difficult to expect.
Sources (26)
- Introduction to Sociology 3e — 20.1 Demography and Population
- Introduction to Sociology 3e — 13.1 Who Are the Elderly? Aging in Society
- 저출산의 원인 분석: 경제적 요인을 중심으로DOI 10.29274/ews.2024.36.3.67
- Lowest-low Fertility and Super-aged Society: Causes and Impacts of the Extreme Population Structure, and Policy OptionsDOI 10.2139/ssrn.4725518
- Later, Fewer, None? Recent Trends in Cohort Fertility in South KoreaDOI 10.1215/00703370-10585316
- Future Fertility in Low Fertility CountriesDOI 10.1093/oso/9780198813422.003.0007
- Is Lowest‐Low Fertility in Europe Explained by the Postponement of Childbearing?DOI 10.1111/j.1728-4457.2004.010_1.x
- 우리나라 출산율에 대한 재고찰- 합계출산율 지표의 한계와 완결출산율 분석을 중심으로DOI 10.33900/kaps.2023.32.4.8
- Demographic Transition and Economic DevelopmentDOI 10.1093/oso/9780195121582.003.0016
- 출산율의 장기결정요인에 관한 분석DOI 10.30776/jes.44.2.3
- The Demographic TransitionDOI 10.30541/v23i4pp.531-552
- 인구 고령화의 인구학적 요인 분석DOI 10.15709/hswr.2023.43.1.50
- Population AgingDOI 10.2139/ssrn.893608
- 교육수준과 인구고령화 지표 (1995 - 2020) - 장래연령 접근DOI 10.22886/jkos.2022.27.2.22
- Economic and Non-economic Determinants of the Lowest-Low Fertility Rate in Korea: An Analysis of Survey ExperimentsDOI 10.2139/ssrn.4655594
- 고용형태와 기업규모별 출산율 결정요인DOI 10.35526/srd.2025.57.3.006
- 주택가격이 합계출산율에 미치는 영향: 시군구 단위 분석을 중심으로DOI 10.22773/rpr.2026.37.1.1
- 합계출산율에 영향을 미치는 요인 : 가치관, 경제적, 성평등요인을 중심으로DOI 10.22743/kwr.2024.6.6.931
- Lowest-Low Fertility in South Korea: Policy and Domestic Labor Supports and the Transition to Second BirthDOI 10.1093/sf/soz159
- Korea's Strong Familism and Lowest‐Low FertilityDOI 10.1111/j.1475-6781.2008.00116.x
- The Confucian Fertility Paradox: Education Competition and Ultra-Low Fertility in East AsiaDOI 10.2139/ssrn.7188704
- An Empirical Study for Implications to Respond the Crisis of Local Population Decline in South KoreaDOI 10.14251/jscm.2022.6.13
- Demographic Transition: The Current PositionDOI 10.1093/oso/9780198286592.003.0003
- 일본의 합계출산율 상승기점의 정책 변화에 관한 고찰DOI 10.18075/jcs..69.201901.189
- 우리나라 사망력 개선 시각화와 기대수명 증가에 대한 연령별 기여도 분석DOI 10.22886/jkos.2020.25.3.1
- 국내 코호트 합계출산율의 장기 추이 분석DOI 10.15709/hswr.2020.40.3.534