
Paperis Articles
Weather and Climate — Today's Roll, the Shape of the Die
Weather is the state of the air over hours to days, and climate is the average and range of that weather gathered over many years. Differences in pressure make wind, and rising, cooling air makes clouds and rain.
Your field's papers, as audio
Pick your fields and journals — Paperis summarizes the key papers and turns them into audio. Listen on your commute.
Start Paperis free →Weather and Climate — Today's Roll, the Shape of the Die
Two Reasons to Pack an Umbrella
You open your phone in the morning, see a 70% chance of rain in the afternoon, and pack a folding umbrella. Throughout the entire month of July, you drop an umbrella into your bag without checking anything first. The former is a judgment made by looking at a single day today, and the latter is a judgment made by looking at summers experienced across many years.

Illustration: Paperis
The two judgments look at different things. Weather is the state of the air at a certain place over a span of several hours to days. Climate is the average and range of weather that repeats over many years in a single region. Climate does not refer to the rain or cold of any single day (OpenStax Biology 2e 44.5).
This article carries a single die along with it. Today's weather is the face rolled by tossing the die once. Climate is the shape of that die, namely what faces it is built to land on and how often. You cannot know the shape of a die by tossing it once; you must toss it many times to find out.
We will follow along in turn: what the air above our heads is and why it moves, how rain comes down, how weather and climate differ, and how far forecasts are right. The principles apply everywhere on Earth, and the examples are drawn mostly from the Korean Peninsula.
The Thin Layer of Air Above Our Heads
When you climb a mountain, the summit is colder than the foot of the mountain. Within this layer of air that grows colder the higher you go, almost all rain and wind take place.
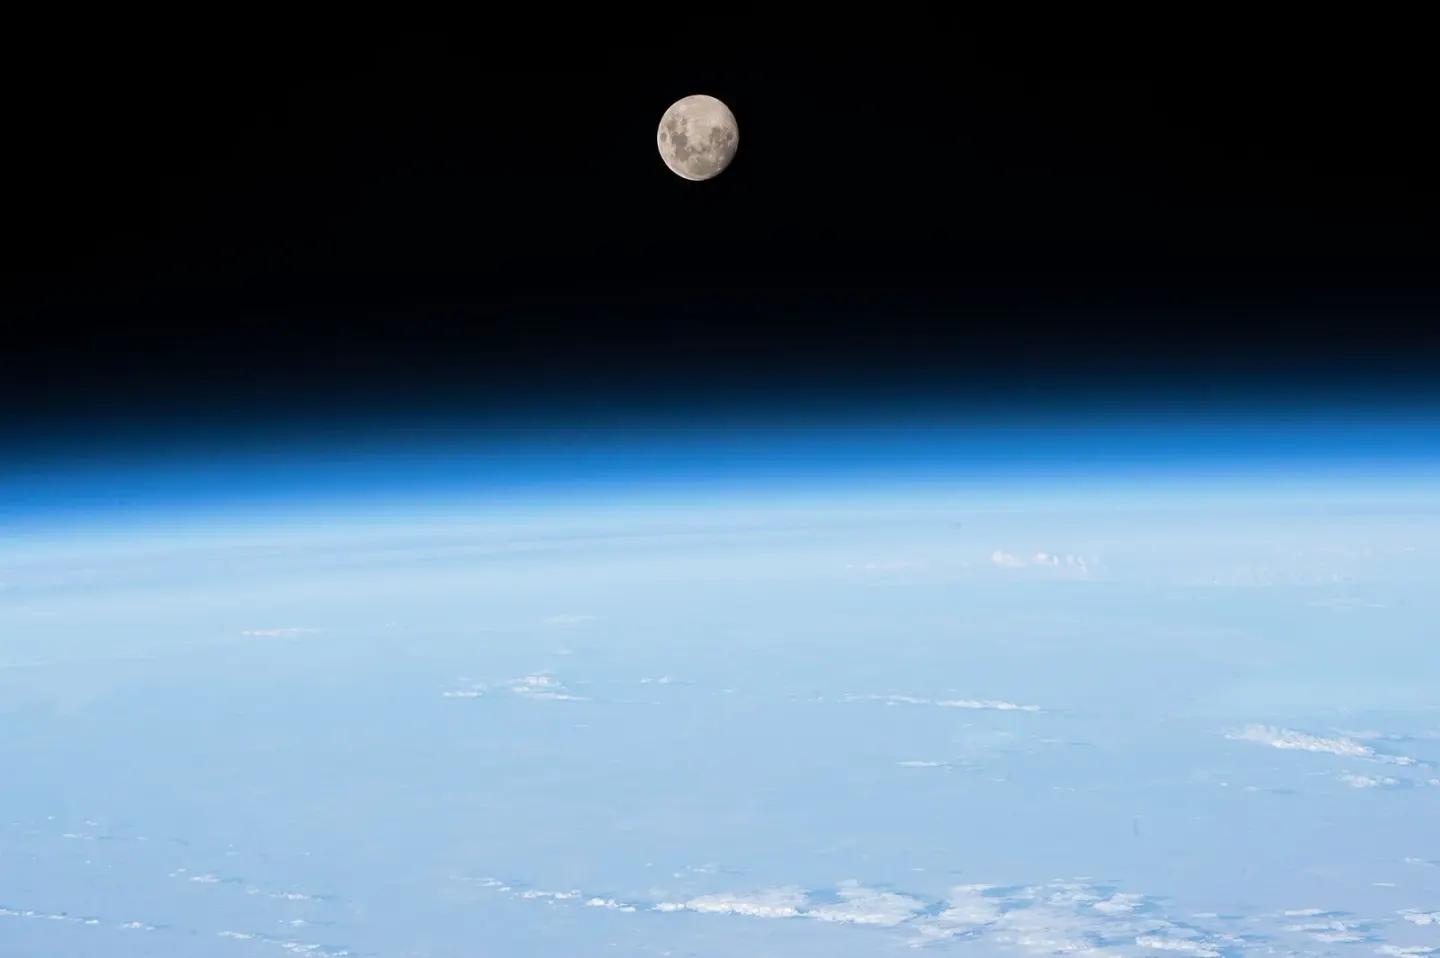
The thin layer of atmosphere at Earth's edge, seen from the International Space Station · NASA · Wikimedia Commons (public domain)
The atmosphere is the layer of air surrounding the Earth. The air we breathe is roughly eight-tenths nitrogen and two-tenths oxygen (78% nitrogen and 21% oxygen), mixed with a very small amount of water vapor, the raw material for rain (OpenStax Astronomy 2e 8.3).
The troposphere is the lowest layer of the atmosphere, where almost all weather such as rain and wind takes place. Its thickness is about 10 kilometers, and its top is close to minus 50 degrees Celsius (OpenStax Astronomy 2e 8.3). In this layer, the air becomes thinner and colder the higher you go (OpenStax Chemistry 2e 9.1).
The stratosphere is the second layer lying above the troposphere, mostly free of clouds. It extends up to about 50 kilometers from the ground, and because ozone in the upper part absorbs ultraviolet rays from sunlight, it conversely gets warmer the higher you go (OpenStax Astronomy 2e 8.3).
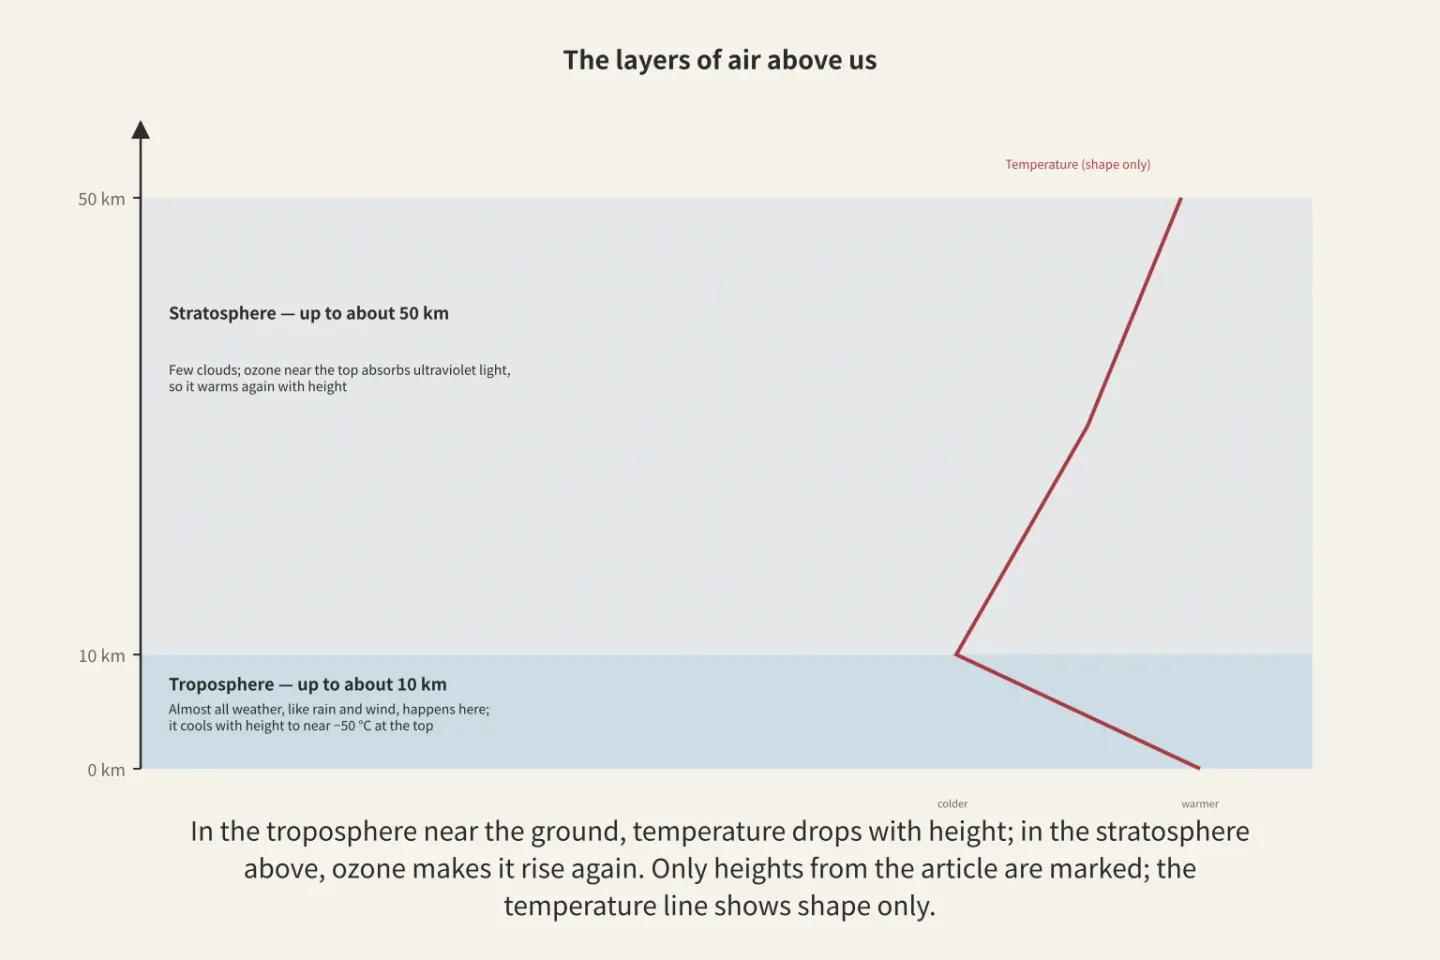
Figure: a diagram Paperis drew using only what the article says
The rain and wind we experience take place in the troposphere, within about 10 kilometers from the ground.
The Weight of the Air Calls the Wind
In winter, when the entire Korean Peninsula grows cold, winds blow from the north; in summer, when the entire peninsula grows warm, winds blow from the south (KCI ART001462267). What stirs the wind is the varying weight of the air from place to place.
Air pressure is the force exerted by the weight of the air piled up above your head. At sea level, this weight is roughly 1.03 kilograms per square centimeter (OpenStax Astronomy 2e 8.3).
Even at the same altitude, air pressure varies from place to place. A high-pressure system is a place where the pressure is higher than its surroundings, and a low-pressure system is a place where the pressure is lower than its surroundings. Air pushes from regions of high pressure to regions of low pressure, and that movement is wind. This is a simplified picture; which way the actual wind curves as it blows is not covered in this article. The greater the pressure difference between two places, the stronger the wind. One example is how winds in the lower atmosphere speed up along the summer coasts of Asia where the pressure difference becomes the greatest (DOI: 10.1175/1520-0442(2002)015<3630:taseot>2.0.co;2).
In a low-pressure system, humid air rises upward to form clouds (OpenStax Chemistry 2e 9.1). While a low-pressure system formed and grew in the skies southwest of the Korean Peninsula on June 25, 2006, an inward-converging flow of air near the ground and an upward-rising flow above it both intensified, bringing heavy rain to the southwestern Korean Peninsula (KCI ART001329571). Conversely, in northern East Asia, a high-pressure system that moves northward in midsummer scatters bands of rain clouds, making rainfall scarce (DOI: 10.1175/1520-0442(2004)017<0744:voteas>2.0.co;2).
The winter northern winds and summer southern winds of the Korean Peninsula also stem from differences in air pressure. Land warms up and cools down faster than the ocean. Coupled with that difference, the Siberian high settles over the cold continent in winter, and the North Pacific high settles over the ocean in summer, reversing the wind direction with the seasons (KCI ART001462267).
Wind is air moving from a place of high pressure to a place of low pressure, and the difference in how fast land and ocean heat up flips its direction with the seasons.
Rising Air Cools
On a midsummer afternoon, cotton-ball-like clouds rise high into a sky that was clear in the morning, and a downpour pours down around evening. What happened in between is that air moved upward.
When air heated by the sunlight on the asphalt rises, the cooler air around it flows into that empty space. Convection is when heated liquid or gas moves directly to carry heat. This rising and falling of air warmed by the ground creates wind and clouds (OpenStax Astronomy 2e 8.3).
The rising air expands and cools at higher altitudes where atmospheric pressure is low. Cold air can hold less water vapor than warm air, so in cooled air, some of the remaining water vapor turns into water droplets. Condensation is when water vapor, a gas, cools and turns into tiny water droplets. When humid air rises and condenses like this, it becomes a cloud (OpenStax Chemistry 2e 9.1). Clouds form when air rises significantly or loses heat and cools, and they disappear when air sinks and warms, mixes with dry air, or loses water to rain (DOI: 10.1175/1520-0493(1993)121<3040:rocils>2.0.co;2).
It is common across all latitudes for tropospheric clouds to contain water vapor, ice particles, and water droplets that have not frozen even below freezing, and such clouds are deeply involved in the process by which rain is made. Despite decades of observations and theory, the understanding of these processes inside clouds is not yet complete, and they are notorious for being difficult to include in weather forecasts and climate models (DOI: 10.1175/amsmonographs-d-17-0001.1).
When water vapor turns into water droplets, heat is released. Latent heat is heat that goes in and out without changing the temperature while the state changes. The heat contained in water vapor when it evaporates from the ocean condenses inside clouds to warm the air, and the warmed air rises higher. Part of the force that sends cumulonimbus clouds soaring high comes from here.
Air is also pushed upward where two masses of air with different characteristics meet. A front is the boundary where two air masses with different temperatures and humidity touch. When warm, light air meets cold, heavy air, it rides up along that boundary, cools as it rises, and scatters rain (KCI ART001542781; DOI: 10.1007/s00382-014-2268-4).
In early summer on the Korean Peninsula, such a boundary stretches long from east to west. Changma is the season when a long band of rain clouds stretching east and west lingers over the Korean Peninsula in early summer and rain continues. The boundary forming that band is the Changma front.
Torrential downpours during the Changma season follow the path of climbing up the front. When 60 cases of torrential downpours exceeding 150 millimeters a day are divided, the type intertwined with the Changma front was the most common, and in most cases, a strong low-level wind band carried heat and water vapor to the front. In the case of July 12, 2009, warm and humid southwesterly winds climbed along the Changma front and brought heavy rain (KCI ART001542781). The storm that poured rain on Jindo, Jeonnam in July 2004 soared over 10 kilometers high, but its width was less than 50 kilometers (KCI ART001309549). The surrounding wide area was also in a condition where rain clouds could grow, but heavy rain actually concentrated around Jindo that day (KCI ART001309549).
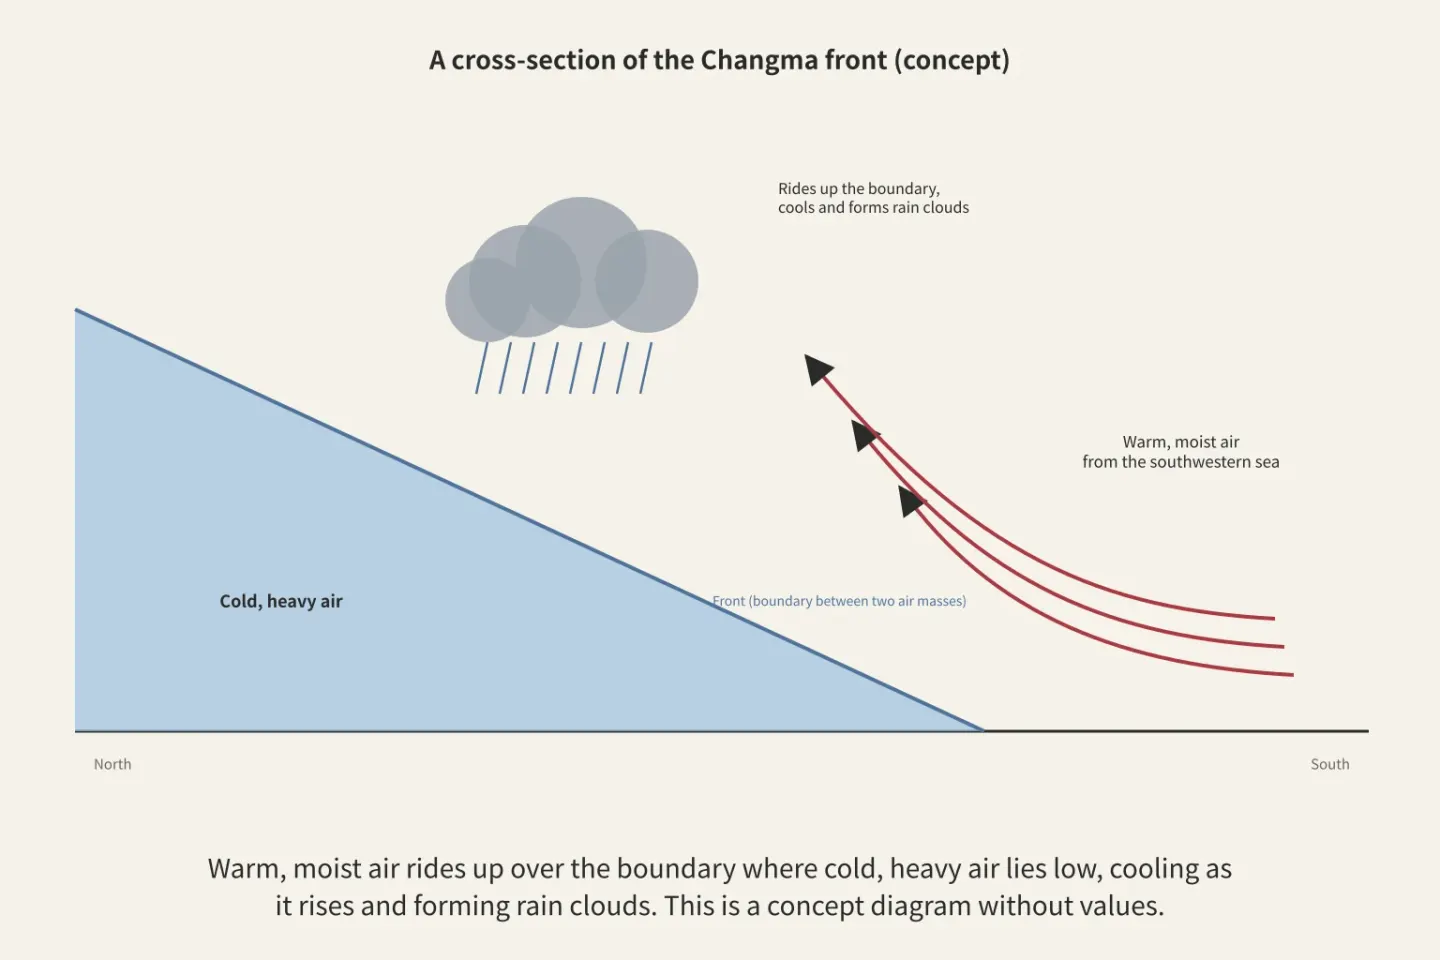
Figure: a diagram Paperis drew using only what the article says
When air rises, it cools, and the water vapor inside the cooled air becomes water droplets, turning into clouds and rain.
From the Equator to the Poles
The areas near the equator are hot all year round, and the polar regions are cold all year round. The atmosphere and the oceans make up for that difference. They mainly carry heat warmed by sunlight toward the side that receives less sunlight (OpenStax Astronomy 2e 8.3).
The tilted axis of rotation, which is why sunlight changes with the seasons, was covered in "Motions of the Sky — A Tilted Spinning Teacup, a Lamp Lit in the Middle", and why heat only flows from the warm side to the cold side was covered in "Heat and Temperature — Water That Only Flows Downhill, a Pump That Lifts It Back Up".
Global atmospheric circulation is a planetary-scale flow of air that carries excess heat from the equator toward the poles. Air warmed near the equator rises to form rain clouds and creates a large overturning circulation that sinks near the subtropics. The tropics and subtropics are linked by this loop (DOI: 10.1029/2020rg000700; DOI: 10.1029/2005rg000172).
The Earth does not receive sunlight evenly, and the atmosphere and oceans carry that heat from the equator to the poles. That movement in the atmosphere is the weather we experience.
Summer Rain on the Korean Peninsula
The monsoonal rainy season comes every year, but the day it arrives differs every year.
Averaging records from 1980 to 2004 across six observation stations in Seoul, Daejeon, Busan, Namwon, Haenam, and Seongsanpo, the rainy season began on June 21 and ended on July 26, and the start date fluctuated much more from year to year than the end date (KCI ART001113906). Both dates are the average of those 25 years.
The rain cloud band lingers while the Asian summer monsoon advances northward and pauses briefly. The early summer rain in southern China, the rainy season in eastern China and Japan, and the rainy season on the Korean Peninsula mostly arrive during that period of pause (DOI: 10.1142/9789812701411_0001). Above the Pacific, where atmospheric pressure becomes higher than usual south of the band pushes the band northward (DOI: 10.1175/1520-0442(2002)015<3630:taseot>2.0.co;2). When the monsoon front is south of 30 degrees north latitude and rises to 30 to 33 degrees, rainfall increases nationwide, which is when the rainy season begins (KCI ART000914831).
Summer rain continues even after the rainy season ends. In the summer of the Korean Peninsula, a phase where heavy rain pours down after the rainy season and a phase where rain is sparse appear separately (DOI: 10.1175/jcli-d-11-00512.1).
In late summer, typhoons move up from the southern seas. A typhoon is a low-pressure system that forms in the warm tropical seas of the northwest Pacific and develops intensely. Countless masses of rain clouds form in the tropical sea, but very few of them grow into typhoons. In 1997, researchers proposed the hypothesis that near-chance encounters of small cloud masses are involved at that fork in the road, and only a few cases of formation were observed. In a case tracing the process by which a single tropical cyclone forms, almost all the heat that warmed the upper layer around the newly formed eye came from the process of water vapor condensing, while in the lower and middle layers, the heat of condensation and the warming of sinking air warmed it together (DOI: 10.1175/1520-0493(1997)125<2643:miitcg>2.0.co;2).
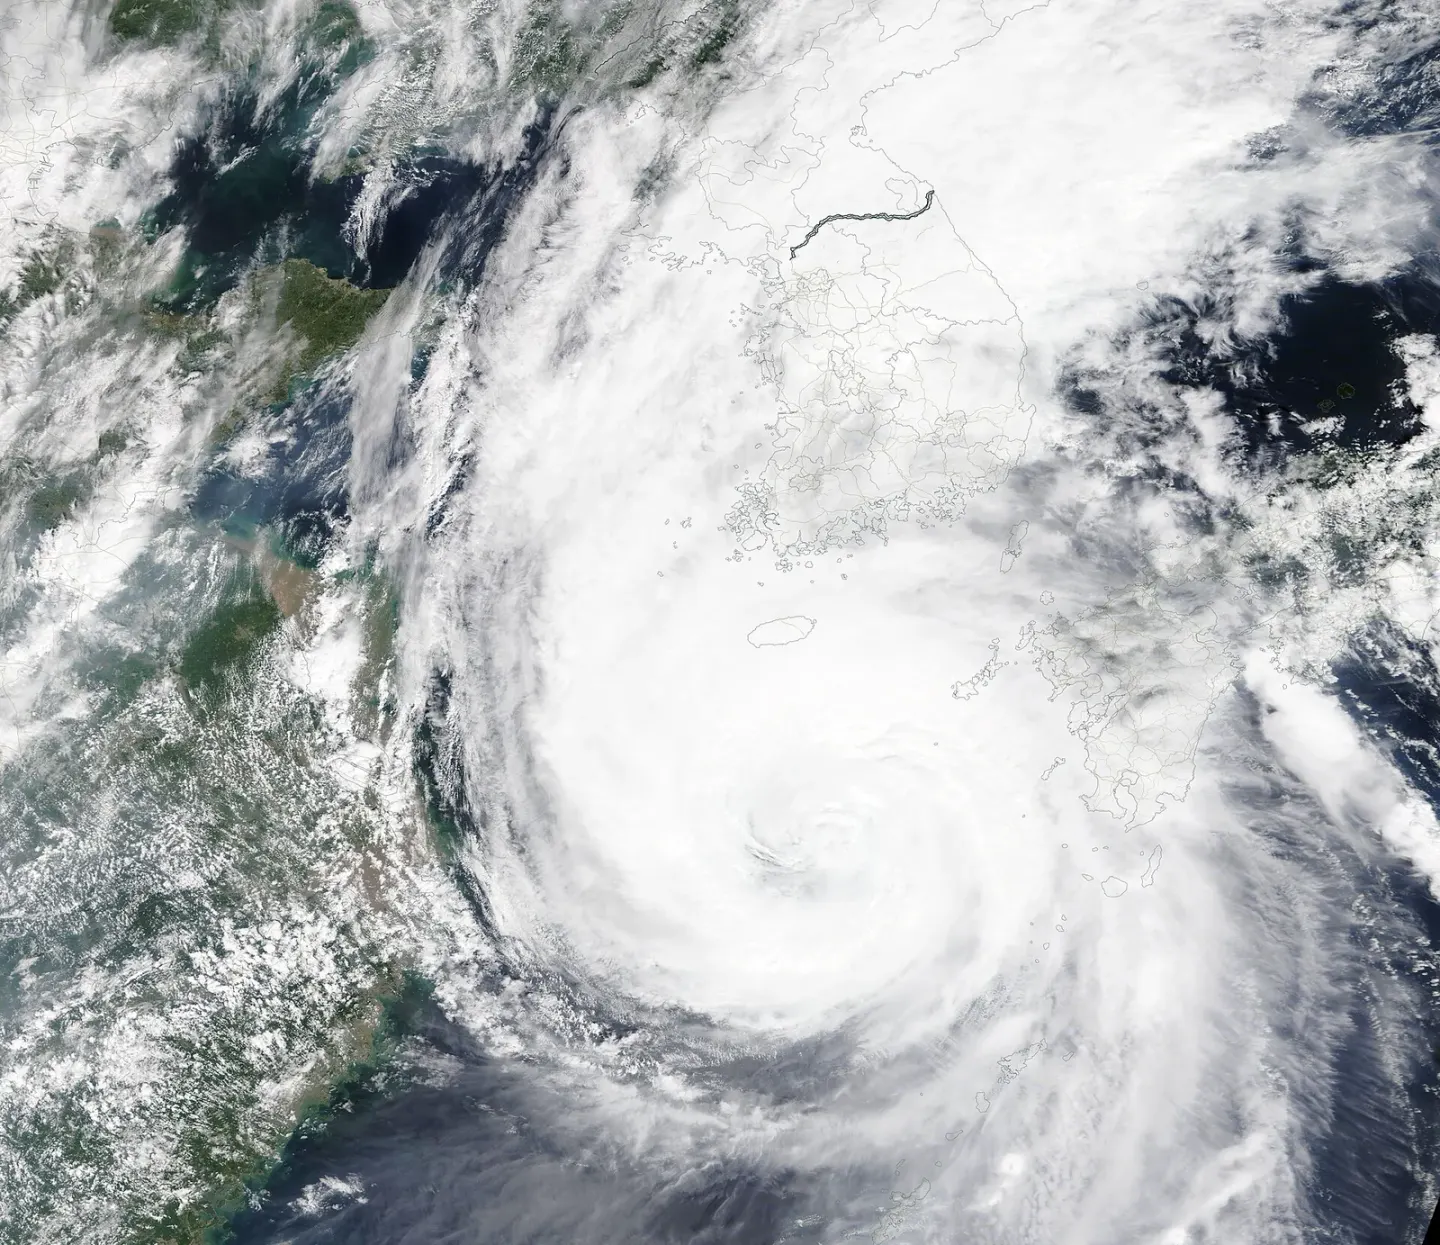
Typhoon Maysak approaching the Korean Peninsula on September 3, 2020 · NASA Terra/Aqua MODIS · Wikimedia Commons (public domain)
What people experience also differs depending on which path a typhoon takes. Looking at typhoons that affected Gyeongsangbuk-do from 1978 to 2006, typhoons that passed through the Yellow Sea were linked to cases that brought only heavy rain, while typhoons that moved up to the southern coast were linked to cases that brought both strong winds and heavy rain. During the same period in coastal regions, cases of heavy rain brought by typhoons increased significantly, but cases of strong winds remained almost the same (KCI ART001309649). Because these are records of one region for 29 years, they are too narrow to broaden into a conclusion for the entire Korean Peninsula.
The rainy season and typhoons are the same principle of air rising, cooling, and water vapor condensing happening on a seasonal scale, and their starting dates and passing paths differ every year.
A Multi-Month Tilt, El Niño
Years with early monsoons and years with late monsoons are connected to the temperature of the distant open ocean that spring.
El Niño is a phenomenon where the seawater in the equatorial Pacific becomes warmer than usual over several months. When the ocean gets warmer, the atmospheric pressure distribution above it changes, and the altered winds change the ocean back. The idea that this mutual push-and-pull between the ocean and the atmosphere is the essence of El Niño was confirmed during a decade of focused observation on the tropical ocean and atmosphere, but how far in advance El Niño could be accurately predicted was still under debate even then (DOI: 10.1029/97jc03424).
The monsoon season on the Korean Peninsula is also linked to it. The year-to-year variation in the start date of the monsoon was clearly connected to the sea surface temperature in the central equatorial Pacific that April (KCI ART001113906). In the summer following an El Niño event, rainy phases like the monsoon appeared more frequently, whereas the connection was weaker following its counterpart, La Niña (DOI: 10.1007/s00382-014-2268-4).
To put it in terms of dice, El Niño slightly tilts the die for a few months so that certain numbers come up a bit more often. What number will appear on any given day is still impossible to know. El Niño changes which way the weather tilts over the course of several months.
Average and Range
In December 2015, East Asia and the Korean Peninsula were record-breakingly warm. In the very next month, January 2016, a strong cold wave lasted for more than two weeks (KCI ART002123822). Within the same winter, one month brought record warmth and the next month brought severe cold.
Climate is the average and range gathered by collecting all such ups and downs across many years, and a single winter is just one roll within it. Researchers considered that the warmth of December could be explained by that year's El Niño, the high-pressure system connected to it, and the strengthening of the vortex above the Arctic, and suggested the possibility that strong Arctic warming and tropical atmospheric flows indirectly helped the cold wave intensify (KCI ART002123822). We cannot say the climate has grown colder from a single January cold wave, nor can we say it has grown warmer from a single December warmth.
There is also a standard for determining "normal." Climate normals are values obtained by averaging observations over the recent 30 years to serve as the benchmark for "normal." Based on a 2023 paper, the World Meteorological Organization, an international body in the meteorological field, recommends using the 30-year period from 1991 to 2020 as that benchmark (DOI: 10.3390/rs15235598). As of January 1, 2021, the benchmark shifted from 1961–1990 to these 30 years, and a commentary noted that on that day the world's climate became "suddenly" warmer by nearly 0.5 degrees on paper (DOI: 10.20935/al102). Temperatures did not change overnight; the standard of comparison changed. The phrase "hotter than normal" varies depending on which 30 years you compare it against.
We cannot understand the climate fully by looking at averages alone. In records from 1912 to 2020 at six observation stations in South Korea, extremely cold winter days clearly decreased, and influenced by this, extreme summer heat became relatively frequent after the 1990s. Conversely, indicators measuring the extremes of heat had large long-term fluctuations, so over the entire period, rather than being captured as a clear change, those oscillations were greater. At the same time, when divided by the new normals, the annual average temperature and the degree to which hot days were skewed hotter than usual were clearly increasing (DOI: 10.14383/cri.2021.16.2.109). The rain of the East Asian summer monsoon averaged across the entire region also notably swung up and down greatly from year to year and decade to decade over the past 50 years while global temperatures clearly rose. Over the same period, the flow forming the rain belt shifted southward, and the authors considered it very likely or partly due to temperatures having risen differently across latitudes. Therefore, the primary response to warming may be a shift in location rather than in intensity, and that shift can bring floods in one place and droughts in another simultaneously, as it did over the past 50 years (DOI: 10.1175/2010jcli3434.1).
Therefore, a single day's weather cannot serve as evidence of climate in either direction. Using the weather of a single place as evidence of climate change is a common confusion that mixes weather and climate (OpenStax Biology 2e 44.5). Conversely, using a single cold day as evidence that the climate has not changed is the same confusion. A single extremely cold day cannot overturn the judgment that the Earth is getting warmer, nor can a single extremely hot day prove that judgment on its own. Obscured by weather that changes as if randomly from year to year, climate change is difficult to catch over a short period (OpenStax Astronomy 2e 8.3). You cannot tell whether a die has changed from a single roll; you must gather many snows over many years to know. How we judge that the climate is actually changing, and how to sort out the human share in a single extreme weather event, is handled by another piece in this series, "Climate Change — Witnesses Questioned Apart, Suspects Checking Their Alibis".
Climate is the long-gathered average and range of weather, and a single day's weather cannot judge the climate in either direction.
How Far Can Forecasts Be Right?
Typhoon forecast maps feature expanding circles drawn further into the future. A position one day ahead is drawn as a small circle, while a position five days ahead is drawn as a large circle. How far ahead a forecast can be correct is captured in that area.
The atmosphere is unstable, so very small initial differences grow over time. This property sets an upper limit on the period for which momentary weather can be guessed (DOI: 10.3402/tellusa.v34i6.10836). In a 2002 analysis examining global forecasts from three centers including the European Centre for Medium-Range Weather Forecasts, the forecast error for atmospheric pressure patterns in the Northern Hemisphere approached the inherent variability of the atmosphere near the end of a three-week range (DOI: 10.1256/003590002321042135). Even three weeks later, the atmosphere generated by the model looked plausible like the real atmosphere, but that did not mean it guessed that day's atmosphere. In those forecasts from the 2002 analysis, it meant that for specific pressure patterns beyond three weeks, the forecast told little more than that season's normal range.
The inside of the limit has steadily widened. In the same analysis, Northern Hemisphere pressure pattern forecasts gained about another day of accuracy over the preceding decade, and verification by the European Centre for Medium-Range Weather Forecasts revealed that simultaneous improvements in observations, models, and initial state estimation were the reason (DOI: 10.1256/003590002321042135). Recently, machine learning forecasts trained on past records have also emerged. In a 2024 analysis, when one such model started from the same initial state as the European Centre for Medium-Range Weather Forecasts' flagship forecast, it showed similar accuracy in global surface and extreme events, but also revealed overly smooth forecasts, biases that grow further into the future, and weaknesses in guessing typhoon intensity (DOI: 10.1175/bams-d-23-0162.1).
The degree to which a forecast might be wrong is also measured in advance. The U.S. National Centers for Environmental Prediction ran multiple two-week global forecasts every day with slightly varied initial states. In tests, the average of multiple forecasts was better than any single-run forecast, and a useful relationship was also seen between the spread of the forecasts and the actual error (DOI: 10.1175/1520-0493(1997)125<3297:efanat>2.0.co;2). Small cumulonimbus rainclouds like the storm in Jindo seen earlier have lower predictability, so rain in a single neighborhood is presented as probabilities by running multiple forecasts together (DOI: 10.1002/met.1538). The precipitation probability seen in the morning is also a number that tells of possibilities instead of a single answer.
Typhoon paths are the same. The largest errors in typhoon track forecasts from numerical weather prediction models came from failing to timely capture where typhoons turn their direction, and the models generally showed a bias toward typhoons moving slower than reality (KCI ART001951306). The expanding circles on forecast maps as days go on embody these errors.
Seasonal forecasts looking ahead several months ask whether that season's rain or temperature will lean higher or lower than normal. In the U.S., seasonal forecasts calculating the atmosphere, ocean, and land together, which began operations in 2004, first showed skill comparable to statistical techniques in U.S. temperatures and precipitation (DOI: 10.1175/jcli3812.1). Successfully predicting the year-to-year variation of the East Asian summer monsoon in advance ranks among the hardest challenges in climate prediction. Even so, an empirical model built from El Niño and springtime North Atlantic pressure oscillations showed skill comparable to an ensemble of 14 latest models in a hindcast test spanning 1979–2006 (DOI: 10.1029/2009jd011733).
There is a limit drawn by the atmosphere itself on how far weather forecasts can be correct, the inside of it has gradually widened, and beyond it we can only tell which way the season leans.
Back to the Dice
The dice analogy was useful up to the point of separating weather and climate, but it differs from the real atmosphere in two ways. First, a die is done once it is rolled, but the atmosphere moves according to the laws of atmospheric pressure and heat, which is why we can watch it roll and guess the next outcome up to a few days ahead. That is why forecasts are correct, and that is also why a small initial difference grows until it looks like a random roll a few weeks later. Second, a real die does not change its shape, but the climate can change. How we know that will be continued in the other parts of this series.
To summarize: Weather is the state of the troposphere's air at any given moment, and that air moves primarily because it is warmed by sunlight. Differences in air pressure create wind, and air that cools as it rises makes clouds and rain. The monsoon season and typhoons are the same principle occurring on a larger scale, and El Niño tilts that weather to one side for several months. Climate is the average and range of all that weather.
Where to Look Next
Why the sunlight we receive changes with the seasons continues in "Motions of the Sky — A Tilted Spinning Teacup, a Lamp Lit in the Middle", and why heat flows from the warmer side to the cooler side continues in "Heat and Temperature — Water That Only Flows Downhill, a Pump That Lifts It Back Up". Comparing weather records with the records of past societies can be seen in "Did Drought Bring Down the Maya? — Setting the Record of the Weather Against the Record of the Cities" and "Did Nature Bring Down the Western Roman Empire? — What Lead in Ice and Bacteria in Bones Can and Cannot Tell Us". Where carbon dioxide in the air comes from and where it goes is covered by another part of this series, "The Carbon Cycle — Jars Buried in the Yard, a Winter Room with Sealed Door Gaps", and what evidence the judgment that the climate is changing comes from is covered by "Climate Change — Witnesses Questioned Apart, Suspects Checking Their Alibis".
Source Papers
- "Astronomy 2e — 8.3 Earth’s Atmosphere" (2022) — OpenStax Astronomy 2e 8.3 — Sea-level air pressure is 1.03 kg per cm², the troposphere is roughly 10 km thick (near −50°C at the top, with convection of sun-warmed air driving clouds and wind), the stratosphere is roughly 50 km thick (mostly cloudless, with ozone absorbing ultraviolet light and causing temperature inversion), surface air is 78% nitrogen, 21% oxygen, and trace water vapor, weather energy comes mainly from sunlight, and the atmosphere and oceans move heat around, while climate change is hard to catch over short periods because it is hidden by random year-to-year weather fluctuations.
- "Chemistry 2e — 9.1 Gas Pressure" (2019) — OpenStax Chemistry 2e 9.1 — (Meteorology sidebar) In low-pressure systems, moist air rises and condenses to form clouds, and in the troposphere, air density and temperature decrease with increasing altitude.
- "Biology 2e — 44.5 Climate and the Effects of Global Climate Change" (2018) — OpenStax Biology 2e 44.5 — Viewing a single weather event in a specific region as evidence of climate change is a common misconception stemming from the confusion between weather and climate (one direction), and climate does not deal with a day's rain or a day's cold.
- "Characteristics of the Monsoon Climate in the Korean Peninsula" (2010) — KCI ART001462267 — Analyzing 61 stations, winters across the Korean Peninsula becoming colder are linked to northerly winds, and summers becoming warmer are linked to southerly winds, connected to continental-scale ocean-land specific heat differences and their circulation like the Siberian High and Western North Pacific High, with a peninsula-scale monsoon circulation also existing and precipitation concentrated in summer.
- "Temporal and Spatial Evolution of the Asian Summer Monsoon in the Seasonal Cycle of Synoptic Fields" (2002) — DOI: 10.1175/1520-0442(2002)015<3630:taseot>2.0.co;2 — Data from 1979–99 show that changes in sea-level pressure differences between the continent and surrounding oceans drive the Asian summer monsoon, high-pressure anomalies south of the rain belt push the belt northward to initiate the changma-style monsoon, and lower-level winds accelerate along the coastline where the pressure gradient is maximized.
- "Kinematic Characteristics of Synoptic Data for the Heavy Rainfall Case on June 25, 2006, Occurred over the Changma Front" (2009) — KCI ART001329571 — Heavy rainfall in the southwestern Korean Peninsula on June 25, 2006, saw convergence below 850 hPa and upper-level divergence strengthen during the stage where a surface low-pressure system formed and developed over the changma front, increasing upward velocity between 850 and 200 hPa.
- "Representation of Clouds in Large-Scale Models" (1993) — DOI: 10.1175/1520-0493(1993)121<3040:rocils>2.0.co;2 — Clouds form along with large-scale ascent, cooling, and turbulence, and disappear through warming, mixing with dry air, and precipitation (European Centre for Medium-Range Weather Forecasts model test).
- "Mixed-Phase Clouds: Progress and Challenges" (2017) — DOI: 10.1175/amsmonographs-d-17-0001.1 — Clouds containing water vapor, ice, and supercooled water droplets together are common at all tropospheric latitudes and crucial for precipitation formation, yet despite decades of research, our understanding remains incomplete and difficult to incorporate into forecasting and climate models (review).
- "A Study on Heavy Rainfall by Inflow of Lower-Level Jet over Changma Front" (2011) — KCI ART001542781 — Among 60 heavy rainfall cases exceeding 150 mm per day, the changma type (including combined typhoons and low pressure) is the most frequent, with most cases having an 850 hPa lower-level jet transporting heat and moisture to the changma front, and in the July 12, 2009 case, warm, moist southwesterly winds rose along the front to cause heavy rain.
- "A Study on the Structure of Mesoscale Heavy Rainfall Systems Occurred on the Changma Front" (2008) — KCI ART001309549 — Jindo heavy rainfall on July 13–14, 2004, featured storm sizes smaller than 50×50 km² on radar and vertical development exceeding 10 km, with convergence and ascent along the changma front amplifying the heavy rain.
- "Atmospheric bridge, oceanic tunnel, and global climatic teleconnections" (2007) — DOI: 10.1029/2005rg000172 — On a global scale, the tropics and subtropics interact via the atmospheric Hadley circulation and the oceanic subtropical circulation (review, original work verified: not a book review).
- "Monsoons, ITCZs, and the Concept of the Global Monsoon" (2020) — DOI: 10.1029/2020rg000700 — Tropical and subtropical rain belts (ITCZs and monsoons) arise from the overturning circulation of the tropical atmosphere and the seasonal shifting of its convergence zones, with regional monsoons embedded within them (review, original work verified: not a book review).
- "Definition of the Start, End, and Intensity of Changma during the Summer Monsoon Period" (2005) — KCI ART001113906 — Based on 1980–2004 averages from 6 representative stations, changma starts on June 21 and ends on July 26, with the year-to-year variation in the start date significantly greater than that of the end date, and start date variations significantly correlated with April NINO4 sea surface temperature anomalies.
- "SEASONAL MARCH OF THE EAST-ASIAN SUMMER MONSOON" (2004) — DOI: 10.1142/9789812701411_0001 — The East Asian summer monsoon advances northward in a stepwise manner, with South China's early summer rainy season, mei-yu/baiu, and changma occurring during stationary pauses in this northward march, premised on land-sea thermal contrasts (review chapter).
- "Characteristics of Korean Precipitation Distribution Seen from the Position of the Changma Front" (2003) — KCI ART000914831 — When the changma front moves northward from south of 30°N to 33–35°N (Note: Korean text says 30 to 33), nationwide precipitation increases, marking the onset of changma during this period.
- "Variation of the East Asian Summer Monsoon Rainfall" (2004) — DOI: 10.1175/1520-0442(2004)017<0744:voteas>2.0.co;2 — The life cycle of the East Asian monsoon passes through the early summer mei-yu rain belt, the midsummer subtropical high, and the late summer tropical cyclone, and in the north, the advancing subtropical high scatters the rain belt, bringing a monsoon hiatus.
- "Nonlinear, Intraseasonal Phases of the East Asian Summer Monsoon: Extraction and Analysis Using Self-Organizing Maps" (2012) — DOI: 10.1175/jcli-d-11-00512.1 — Four phases of the summer monsoon (mei-yu-baiu, changma, heavy post-changma rain in the Korean Peninsula, and dry season) were identified, and the changma and dry season phases are heavily modulated in El Niño and La Niña years.
- "Mesoscale Interactions in Tropical Cyclone Genesis" (1997) — DOI: 10.1175/1520-0493(1997)125<2643:miitcg>2.0.co;2 — Among the countless cloud clusters in tropical oceans, growing into a tropical cyclone is rare, and the authors hypothesize that the preceding mesoscale interactions are inherently probabilistic (with only a few observed genesis cases), with nearly all the heat that warmed the eye in the case coming from upper-level moist processes (latent heat). *Outside shortlist (sources-openalex.txt).
- "Analysis of Typhoon-Induced Impacts and Track-Specific Characteristics in Gyeongsangbuk-do" (2008) — KCI ART001309649 — In Gyeongsangbuk-do from 1978 to 2006, typhoon heavy rainfall cases increased significantly in coastal areas while strong winds showed minimal change, and typhoons passing through the West Sea were linked to heavy rain alone, whereas those making landfall on the South Sea brought both strong winds and heavy rain together. *Outside shortlist (sources-kci.txt).
- "ENSO theory" (1998) — DOI: 10.1029/97jc03424 — The Bjerknes hypothesis—that ocean-atmosphere interactions are the essence of the El Niño-Southern Oscillation—was confirmed during the 10 years of TOGA, and theoretical limits on ENSO predictability are still debated (review).
- "Thermodynamic characteristics and responses to ENSO of dominant intraseasonal modes in the East Asian summer monsoon" (2014) — DOI: 10.1007/s00382-014-2268-4 — In response to preceding El Niños, the mei-yu-baiu and changma phases become more frequent while the post-changma and dry season phases reverse, with responses to La Niña being relatively weak and asymmetric.
- "Analysis of Climate Characteristics over East Asia and the Korean Peninsula in the 2015/16 Winter" (2016) — KCI ART002123822 — The record warmth in December 2015 and the strong cold wave lasting over two weeks in January 2016 are explained: December warmth by a strengthened Kuroshio high and intensified polar vortex linked to El Niño, and January cold wave by a blocked cold wave following an extreme negative Arctic Oscillation, with suggestions that intense Arctic warming and the MJO may have indirectly contributed to strengthening the cold wave.
- "Difference between WMO Climate Normal and Climatology: Insights from a Satellite-Based Global Cloud and Radiation Climate Data Record" (2023) — DOI: 10.3390/rs15235598 — The World Meteorological Organization recommends calculating climate normals using the most recent 30-year period (1991–2020) (original work verified: satellite data research paper, not a book review).
- "Climates Multiple: Three Baselines, Two Tolerances, One Normal" (2021) — DOI: 10.20935/al102 — A commentary noting that on January 1, 2021, the World Meteorological Organization standard climate normal shifted from 1961–1990 to 1991–2020, which was akin to the global climate becoming nearly 0.5°C warmer "suddenly" on that day.
- "Trends in Extreme Temperatures in South Korea Based on New Climate Normal Standards" (2021) — DOI: 10.14383/cri.2021.16.2.109 — Across 6 stations from 1912 to 2020, extreme indices related to winter minimum temperatures (such as days below −12°C) changed significantly, extreme high-temperature indices were dominated by low-frequency variability rather than significant climate change, but decomposition based on the new normals revealed a significant upward trend in annual mean, annual cycle amplitude, and daily high-temperature anomalies.
- "Can Global Warming Strengthen the East Asian Summer Monsoon?" (2010) — DOI: 10.1175/2010jcli3434.1 — Contrary to the global warming trend of the past 50 years, precipitation averaged over the East Asian summer monsoon region is dominated by annual and decadal variability, and from 1958 to 2008 monsoon components shifted southward, very likely or partly due to north-south asymmetric warming, meaning the primary response is a shift in location rather than intensity, which can induce spatial coexistence of floods and droughts.
- "Atmospheric predictability experiments with a large numerical model" (1982) — DOI: 10.3402/tellusa.v34i6.10836 — Atmospheric instability sets an upper limit on the predictability of instantaneous weather patterns, and at the time, 10-day forecasts seemed feasible on par with 7-day forecasts (original work verified: research paper, not a book review).
- "Some aspects of the improvement in skill of numerical weather prediction" (2002) — DOI: 10.1256/003590002321042135 — Across three global forecasting systems, Northern Hemisphere predictability increased by roughly one day per decade over the past 10 years (driven by improvements in data assimilation, models, and observations), with errors near the end of 21-day forecasts saturating close to the level of natural atmospheric variability.
- "The Rise of Data-Driven Weather Forecasting: A First Statistical Assessment of Machine Learning–Based Weather Forecasts in an Operational-Like Context" (2024) — DOI: 10.1175/bams-d-23-0162.1 — Comparing PanguWeather and ECMWF IFS under identical initial conditions, both showed similar accuracy for global surface and extreme phenomena, but with weaknesses including overly smooth forecasts, biases growing with forecast lead time, and tropical cyclone intensity.
- "Ensemble Forecasting at NCEP and the Breeding Method" (1997) — DOI: 10.1175/1520-0493(1997)125<3297:efanat>2.0.co;2 — Since 1994, 17 independent 2-week global forecasts have been run daily, with the ensemble mean outperforming single forecasts, revealing a useful relationship between ensemble spread and forecast error.
- "Convection‐permitting models: a step‐change in rainfall forecasting" (2016) — DOI: 10.1002/met.1538 — The smallest scales involving convection have low predictability and require ensembles to represent uncertainty, which has enabled probabilistic forecasting of localized rainfall (review).
- "Evaluation of Numerical Model Predictability of Typhoon Tracks Considering Movement Speed and Direction" (2014) — KCI ART001951306 — Track errors had large components along the direction of travel with an overall slow bias, and the largest errors stemmed from failing to properly forecast recurvature. *Outside shortlist (sources-kci.txt).
- "The NCEP Climate Forecast System" (2006) — DOI: 10.1175/jcli3812.1 — The coupled ocean-land-atmosphere seasonal prediction system operationalized in August 2004 achieved skill comparable to statistical techniques for the first time in US surface temperature and precipitation.
- "An empirical seasonal prediction model of the east Asian summer monsoon using ENSO and NAO" (2009) — DOI: 10.1029/2009jd011733 — Predicting year-to-year variability in the East Asian summer monsoon is one of the hardest and most important tasks in climate prediction, and the hindcast skill of an empirical model built with ENSO and spring NAO from 1979 to 2006 rivals that of the latest 14 multi-model ensemble, serving as a real-time forecasting tool.
Sources (25)
- Astronomy 2e — 8.3 Earth’s Atmosphere
- Chemistry 2e — 9.1 Gas Pressure
- Biology 2e — 44.5 Climate and the Effects of Global Climate Change
- Temporal and Spatial Evolution of the Asian Summer Monsoon in the Seasonal Cycle of Synoptic FieldsDOI 10.1175/1520-0442(2002)015<3630:taseot>2.0.co;2
- Representation of Clouds in Large-Scale ModelsDOI 10.1175/1520-0493(1993)121<3040:rocils>2.0.co;2
- Mixed-Phase Clouds: Progress and ChallengesDOI 10.1175/amsmonographs-d-17-0001.1
- Atmospheric bridge, oceanic tunnel, and global climatic teleconnectionsDOI 10.1029/2005rg000172
- Monsoons, ITCZs, and the Concept of the Global MonsoonDOI 10.1029/2020rg000700
- SEASONAL MARCH OF THE EAST-ASIAN SUMMER MONSOONDOI 10.1142/9789812701411_0001
- Variation of the East Asian Summer Monsoon RainfallDOI 10.1175/1520-0442(2004)017<0744:voteas>2.0.co;2
- Nonlinear, Intraseasonal Phases of the East Asian Summer Monsoon: Extraction and Analysis Using Self-Organizing MapsDOI 10.1175/jcli-d-11-00512.1
- Mesoscale Interactions in Tropical Cyclone GenesisDOI 10.1175/1520-0493(1997)125<2643:miitcg>2.0.co;2
- ENSO theoryDOI 10.1029/97jc03424
- Thermodynamic characteristics and responses to ENSO of dominant intraseasonal modes in the East Asian summer monsoonDOI 10.1007/s00382-014-2268-4
- Difference between WMO Climate Normal and Climatology: Insights from a Satellite-Based Global Cloud and Radiation Climate Data RecordDOI 10.3390/rs15235598
- Climates Multiple: Three Baselines, Two Tolerances, One NormalDOI 10.20935/al102
- 신 기후평년값 기준 우리나라 극한기온의 변화경향DOI 10.14383/cri.2021.16.2.109
- Can Global Warming Strengthen the East Asian Summer Monsoon?DOI 10.1175/2010jcli3434.1
- Atmospheric predictability experiments with a large numerical modelDOI 10.3402/tellusa.v34i6.10836
- Some aspects of the improvement in skill of numerical weather predictionDOI 10.1256/003590002321042135
- The Rise of Data-Driven Weather Forecasting: A First Statistical Assessment of Machine Learning–Based Weather Forecasts in an Operational-Like ContextDOI 10.1175/bams-d-23-0162.1
- Ensemble Forecasting at NCEP and the Breeding MethodDOI 10.1175/1520-0493(1997)125<3297:efanat>2.0.co;2
- Convection‐permitting models: a step‐change in rainfall forecastingDOI 10.1002/met.1538
- The NCEP Climate Forecast SystemDOI 10.1175/jcli3812.1
- An empirical seasonal prediction model of the east Asian summer monsoon using ENSO and NAODOI 10.1029/2009jd011733