
Paperis Articles
Climate Change — Witnesses Questioned Apart, Suspects Checking Their Alibis
What thermometers, Antarctic ice and the sea record, how causes are told apart, and the words that grade certainty
Your field's papers, as audio
Pick your fields and journals — Paperis summarizes the key papers and turns them into audio. Listen on your commute.
Start Paperis free →Climate Change — Witnesses Questioned Apart, Suspects Checking Their Alibis
Where Did a Number Like "Just Over 1 Degree" Come From?
Weather reports about heatwaves often end with the statement that the global average temperature has risen by just over 1 degree since before industrialization, and that the main cause is humans. For listeners, two questions remain. How did we measure the temperature of the entire earth? The climate has always changed, so why are we saying it is because of humans this time?
Climate change is a shift in the multi-year average of weather and its range over a long period (OpenStax Biology 2e 44.5). A cold or hot day or two is weather, while climate is the multi-year average and range of weather.
As our guide, we will enter a courtroom. First, thermometers, Antarctic ice, and the ocean will take the stand as witnesses to testify about what has changed. Next, volcanoes, the natural swaying of the ocean and air, the sun, the path the earth orbits, and humans will offer alibis as suspects. The final verdict is written using words that establish "how certain it is."
This explanation applies anywhere on Earth, and our examples for the Korean Peninsula are drawn from the height of our seas.
The First Witness, the Thermometer
The period when temperature records from around the world were first gathered in sufficient amounts to calculate a global average is from 1850 to 1900. Assessment reports therefore use this 50-year span as a proxy for pre-industrial times (DOI: 10.1017/9781009157896.001).
A temperature anomaly is a value showing how much a given temperature deviates from the average of a baseline period. One analysis combines land-station temperatures and sea-surface temperatures, dividing the globe into grid cells to calculate global temperature as monthly anomalies (DOI: 10.1175/2007jcli2100.1).
The body that gathers and assesses these calculations is the IPCC. The IPCC is an organization established by the UN in 1988 that reviews scientific literature on climate change and regularly issues assessment reports (Steven Earle, Physical Geology, 2nd Edition ch. 19.02). According to its sixth assessment report, "Climate Change 2021," global surface temperature for 2011–2020 was 1.09 degrees higher than 1850–1900, with a range of 0.95 to 1.20 degrees (DOI: 10.1017/9781009157896.001).
Over the same period, land temperatures rose by 1.59 degrees and ocean temperatures by 0.88 degrees, showing that the land warmed much more (DOI: 10.1017/9781009157896.001). Furthermore, looking at the past 40 years in 10-year blocks, each decade has been warmer than any preceding decade since 1850 (DOI: 10.1017/9781009157896.001).
The witness's testimony also has flaws. Older records contain misrecorded values and gaps in observation, which introduces corresponding uncertainty into the analyses (DOI: 10.1175/2007jcli2100.1). To address suspicions that growing cities may have warmed the surroundings of weather stations, one analysis corrected for this by using satellite images of night lights to screen out urban stations, and the urban effect on the global average was small. The polar regions, where observations are sparse, remain an area that can sway the results (DOI: 10.1029/2010rg000345).
The increase in the numbers compared to the previous report is mainly due to the 0.19 degrees of actual warming that occurred since 2003–2012. In addition, new data and methods that fill in broader areas up to the Arctic contributed about 0.1 degrees, a portion that does not reflect actual warming during that interim (DOI: 10.1017/9781009157896.001). The first witness testifies that the Earth's surface has warmed by a little over 1 degree compared to 1850–1900.
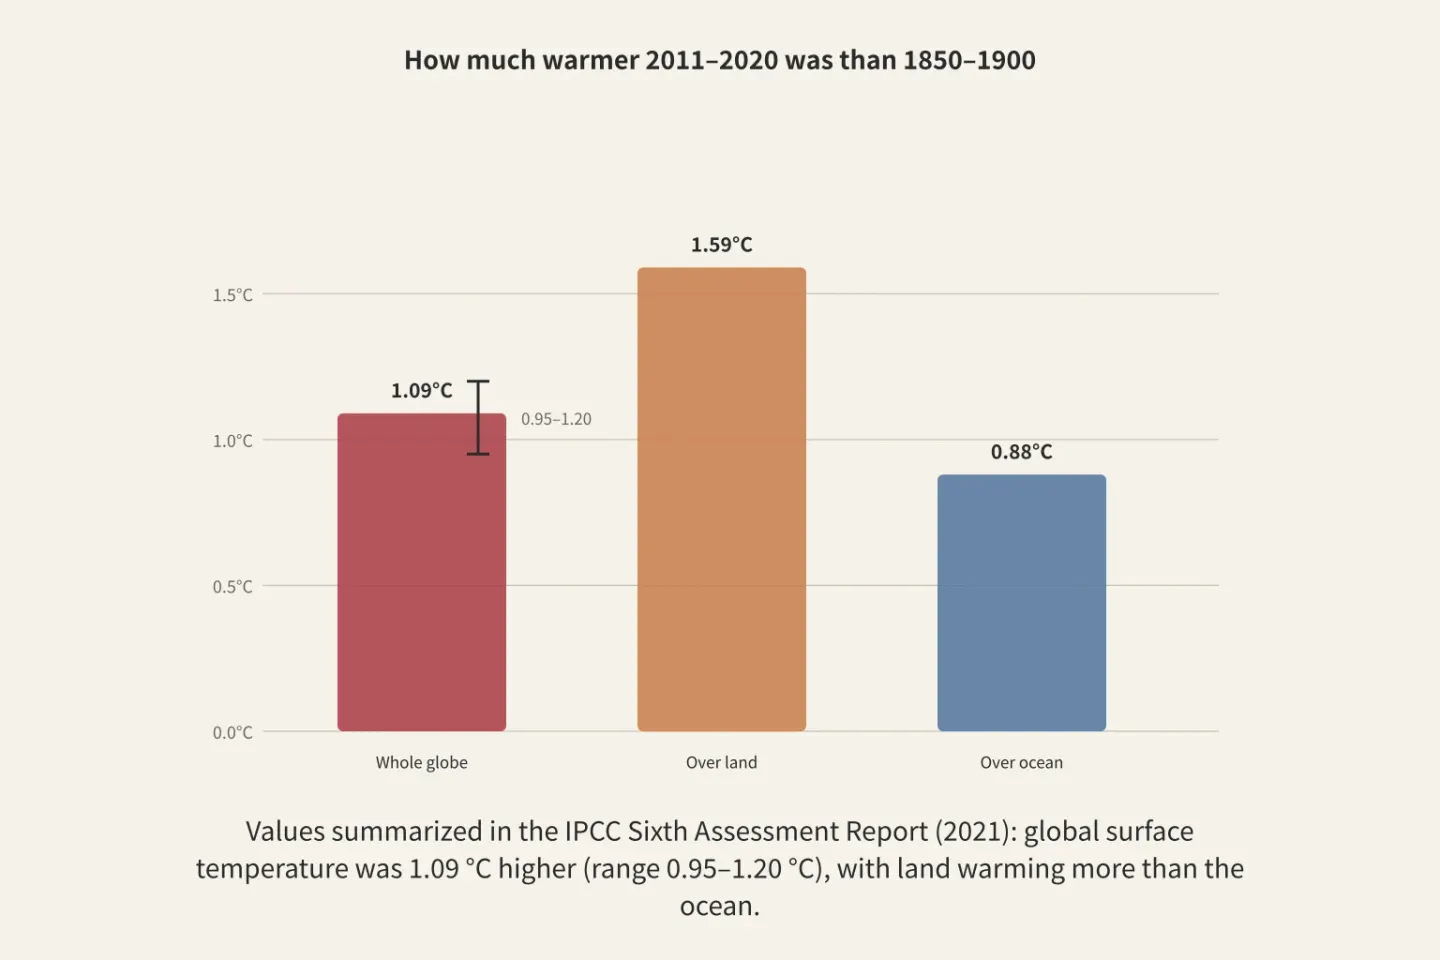
Figure: a diagram Paperis drew from values in the IPCC Sixth Assessment Report (2021)
The Second Witness: Antarctic Ice
Air from times before thermometers is trapped in tiny air bubbles within Antarctic ice. From those bubbles, we read past carbon dioxide concentrations and temperatures (OpenStax Biology 2e 44.5). An ice core is a pillar of ice drilled from top to bottom through thick ice to extract those bubbles, and the deeper it goes, the older the ice is (OpenStax Biology 2e 44.5).

Illustration: Paperis
There is a name that groups these records together. A proxy is a natural record that stands in to tell us about the climate in times before thermometers. Besides ice cores, tree rings, pollen, and deep-sea sediment do this job (OpenStax Biology 2e 44.5).
Ice from Dome C in Antarctica shows atmospheric carbon dioxide continuously for the past 800,000 years (DOI: 10.1002/2014gl061957). Concentration is written in ppm, which means how many carbon dioxide molecules there are out of every 1 million air molecules. In periods older than 430,000 years ago, this concentration swung between 180 and 260 ppm (DOI: 10.1126/science.1120130). During the six glacial cycles up to 650,000 years ago, the relationship between carbon dioxide and Antarctic temperature appears to have been nearly constant (DOI: 10.1126/science.1120130).
The recent past is shown in fine detail by ice from Law Dome in Antarctica, where snow accumulates quickly. In records from 1006 to 1978, the pre-industrial concentration was 275 to 284 ppm, and with natural ups and downs of this magnitude, it is difficult to pin down the pre-industrial value to a single number (DOI: 10.1029/95jd03410). Past a relatively quiet period before that, carbon dioxide, methane, and nitrous oxide have grown significantly over the past 200 years (DOI: 10.1029/2006gl026152).
Looking at data compiled in 2017, the concentration of greenhouse gases in the atmosphere was unprecedentedly high within the past 800,000 years (DOI: 10.5194/gmd-10-2057-2017). Why carbon dioxide traps heat is covered in another part of this series, The Carbon Cycle — Jars Buried in the Yard, a Winter Room with Sealed Door Gaps.
Records are sometimes re-examined. An error produced by analytical equipment in the deepest part of Dome C was uncovered and the record corrected, but the problem of the relationship between carbon dioxide and temperature looking different in that old section has only been partly resolved (DOI: 10.1002/2014gl061957). The second witness testifies that carbon dioxide has grown significantly over the past 200 years, and that its level lies outside the 800,000-year record.
The Third Witness, the Height of the Sea
Around the time the last ice age was at its deepest, the sea was 134 meters lower than it is now. This was the bottom of a slow descent that lasted from 29,000 years ago to 21,000 years ago (DOI: 10.1073/pnas.1411762111).
As the ice sheets melted, the sea rose again. Then, from about 2,500 years ago, the volume of the sea stayed nearly the same, and it began to rise again 100 to 150 years ago (DOI: 10.1073/pnas.1411762111). Between 6,000 years ago and 150 years ago, there is no evidence that the sea level rose or fell by more than 15 to 20 centimeters over any period lasting longer than 200 years (DOI: 10.1073/pnas.1411762111).
From 1901 to 2018, the global average sea level rose 0.20 meters, with a range of 0.15 to 0.25 meters (DOI: 10.1017/9781009157896.001). The rising speed was 1.3 millimeters per year from 1901 to 1971, and became 1.9 millimeters per year from 1971 to 2006 (DOI: 10.1017/9781009157896.001).
From 2006 to 2018, it accelerated to 3.7 millimeters per year. The IPCC attached high confidence to this judgment that the speed increased (DOI: 10.1017/9781009157896.001).
There are two paths by which the sea rises. One is warmed seawater swelling up, and the other is glaciers, snow, and ice on land melting and entering the sea. Ice that was floating in the sea does not directly raise the sea level even when it melts (Steven Earle, Physical Geology, 2nd Edition ch. 19.03). The first path has a name. Thermal expansion is when the size or volume of an object increases or decreases because its temperature changes.
The third witness testifies that the sea, which stayed nearly still for thousands years, has risen again over the past century or so, and that its speed has accelerated.
The Suspects Known as Nature
Over the 6,000 years as the last ice age was ending, atmospheric carbon dioxide increased by 76 ppm (DOI: 10.1126/science.291.5501.112). The climate has changed even without humans, and there are suspects that drive that change.
A forcing is a change in conditions that serves as the first step in climate change. A feedback is when the subsequent changes brought on by that initial change either amplify or diminish the original change. Carbon dioxide increased by fossil fuels is an example of a forcing, and human-caused changes also grow through such feedbacks (Steven Earle, Physical Geology, 2nd Edition ch. 19.01).
The suspect that lingers for the shortest time is volcanoes. Sulfur dioxide spewed by volcanoes becomes aerosols. An aerosol is a very small particle or droplet suspended in the air. Sulfur dioxide aerosols reflect incoming sunlight back out and cool the climate, but they usually settle out within a few years and do not lead to long-lasting changes (Steven Earle, Physical Geology, 2nd Edition ch. 19.01).
Next are fluctuations that occur without being pushed from the outside. Internal variability is a climate fluctuation that the ocean and atmosphere generate on their own through mutual interactions, even without an external pushing force (DOI: 10.1007/s00382-010-0977-x). The water temperature of the tropical Pacific fluctuates as it swings between El Niño and La Niña (DOI: 10.1029/2010rg000345), and those fluctuations occur at intervals of 2 to 7 years. El Niño is a phenomenon where the eastern tropical Pacific Ocean becomes warmer than usual, and years with a strong El Niño have been warmer years globally as well (Steven Earle, Physical Geology, 2nd Edition ch. 19.01).
The Sun is also a suspect. When the intensity of sunlight the Earth receives changes, the Earth's temperature moves in the same direction (OpenStax Biology 2e 44.5).
The slowest suspect is the path along which the Earth travels. An orbit is the path that one celestial body takes as it revolves around another, pulled by gravity. The shape of Earth's orbit and the tilt and direction of its axis of rotation slowly change on cycles of 20,000 to 100,000 years (Steven Earle, Physical Geology, 2nd Edition ch. 19.01). Why seasons exist because the axis of rotation is tilted was covered in "Motions of the Sky — A Tilted Spinning Teacup, a Lamp Lit in the Middle".
This suspect is considered the trigger for ice ages. Cave stalagmite records comparing the ends of the past four ice ages match the explanation that stronger summer sunshine in the Northern Hemisphere caused the northern ice sheets to begin retreating. Afterward, increased carbon dioxide and rising Antarctic temperatures drove the changes that ended the ice age in the Southern Hemisphere, and it is thought that carbon dioxide and sea level reinforced each other (DOI: 10.1126/science.1177840). The force of such large changes is too weak to be driven by orbital changes alone, so most of the changes were created by feedbacks (Steven Earle, Physical Geology, 2nd Edition ch. 19.01). It is true that the climate has always changed, and even during those large changes of the past, increased carbon dioxide drove the changes that ended the ice ages together (DOI: 10.1126/science.1177840).
However, orbits that change on timescales of tens of thousands of years are too slow to explain changes over just a century or so. The remaining question is who caused the changes of the past century or so.
How to Check an Alibi
You run the Earth inside a computer multiple times, changing only the sun in one run, only volcanoes in another, and only carbon dioxide in yet another. By also running a plate with nothing changed and a plate with all factors included, you separate the shares of humans and nature (DOI: 10.5194/gmd-9-3685-2016). This is the method of putting suspects on the stand one by one.
The tool used for this is a climate model. A climate model is a computer program that mimics Earth's climate by calculating the physical processes that the atmosphere, oceans, land, and ice exchange with one another. Models are evaluated against observations based on how well they reproduce past climates. Their skill at mimicking surface temperatures has improved over the previous generation in many ways, but not in all ways (DOI: 10.1017/cbo9781107415324.020).
Detection and attribution means first sorting out whether an observed change is too rare to be explained by natural fluctuations alone, and then dividing up how much various causes contributed to that change. Saying that something has been detected means that the change is very unusual compared to the expected natural variability (DOI: 10.1175/bams-d-18-0189.1).
The IPCC attaches the probability of that judgment being correct to many of its verdicts. Likelihood terminology is a system where the IPCC assigns set phrases—such as "likely" or "very likely"—to indicate the probability that a given judgment is correct. Climate Change 2021 assessed the human-caused rise in Earth's surface temperature from 1850–1900 to 2010–2019 to be within a likely range of 0.8 to 1.3 degrees, with 1.07 degrees as the most likely value (DOI: 10.1017/9781009157896.001).
The same assessment divided up those shares. Well-mixed greenhouse gases warmed the planet by 1.0 to 2.0 degrees, while other human factors—primarily aerosols—likely cooled it by 0.0 to 0.8 degrees (DOI: 10.1017/9781009157896.001).
The natural share was also described using the same "likely" term. The share changed by natural factors like the sun and volcanoes is -0.1 to +0.1 degrees, and the share changed by internal variability is -0.2 to +0.2 degrees (DOI: 10.1017/9781009157896.001). Viewed in terms of the likely range, nature's suspects did not push temperatures significantly in either direction during this period.
The sun's alibi was examined separately. The attribution chapter of the Fifth Assessment Report, published in 2014, noted that while the sun was the only natural factor known to have acted to warm the climate between 1951 and 2010, its increase was far smaller than that of greenhouse gases. The pattern where the lower atmosphere warms while the higher layer above it cools also does not match the response expected if the sun had grown stronger (DOI: 10.1017/cbo9781107415324.022).
That chapter assessed that it is very likely that more than half of the global average surface temperature rise from 1951 to 2010 was due to greenhouse gases increased by humans (DOI: 10.1017/cbo9781107415324.022). Climate Change 2021 assessed that it is very likely the main driver of the warming of the lower atmosphere since 1979 has been well-mixed greenhouse gases (DOI: 10.1017/9781009157896.001).
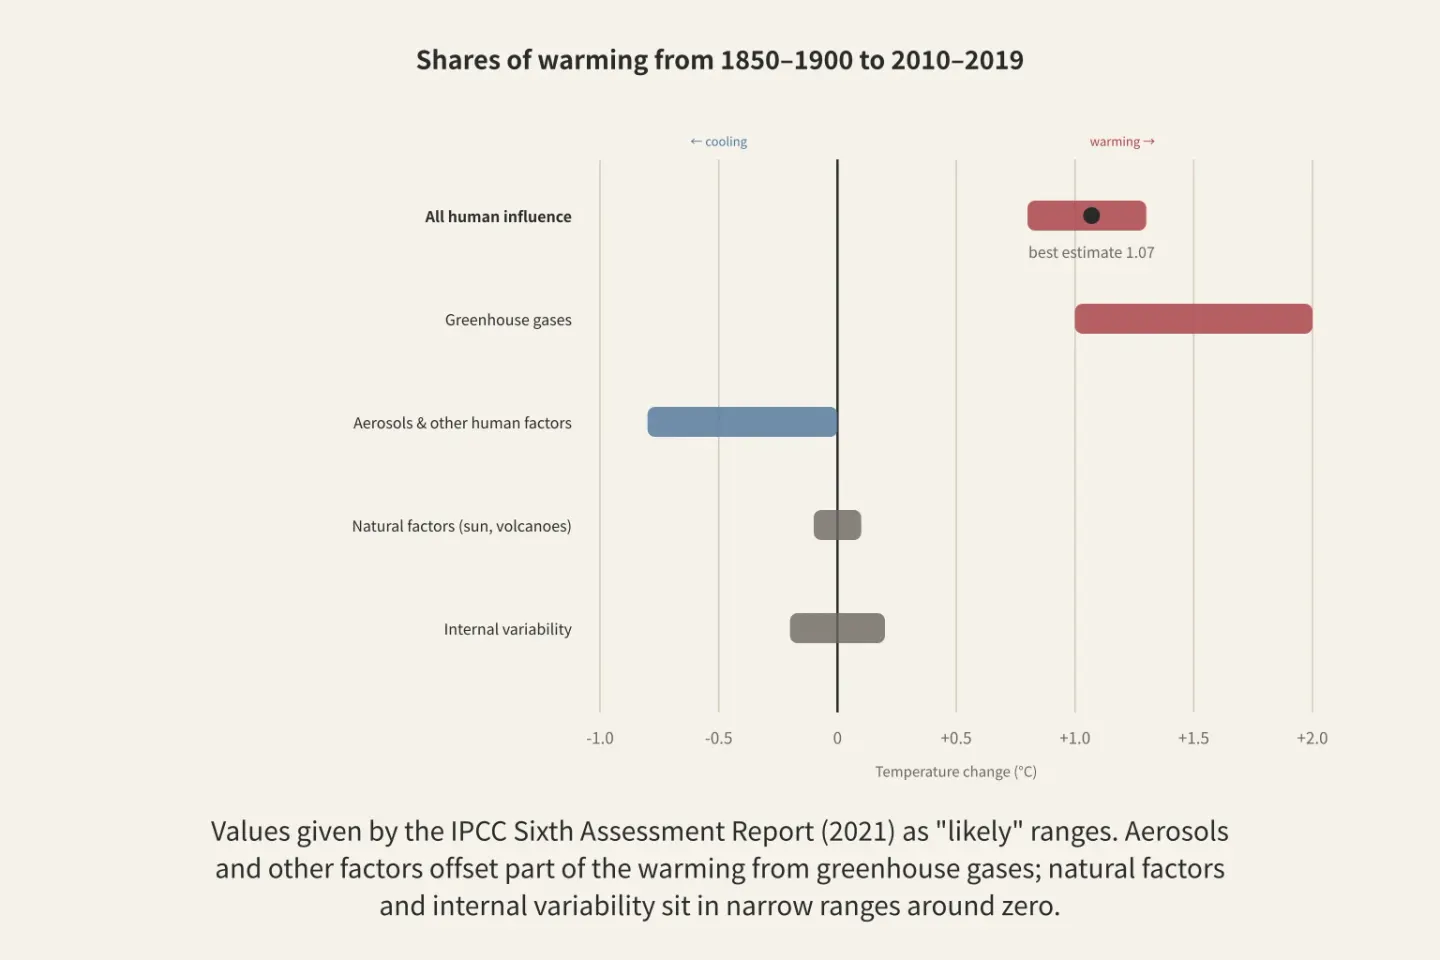
Figure: a diagram Paperis drew from values in the IPCC Sixth Assessment Report (2021)
Words in the Verdict
The judgment that the upper 700 meters of the ocean have warmed since the 1970s is labeled "virtually certain," and the judgment that human activity is the primary cause is labeled "extremely likely" (DOI: 10.1017/9781009157896.001). That human activity is the main reason global glaciers have retreated since the 1990s is "very likely" (DOI: 10.1017/9781009157896.001).
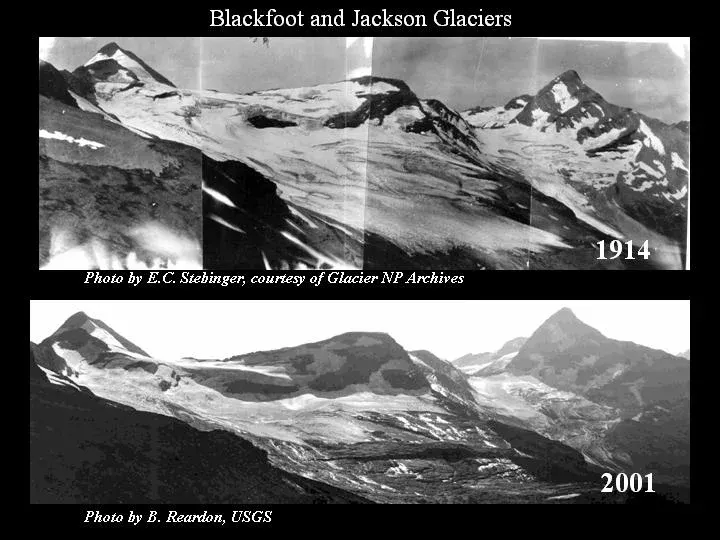
Blackfoot and Jackson Glaciers, Glacier National Park, USA, in 1914 and 2001 · photos E. C. Stebinger (1914), B. Reardon (2001, USGS) · Wikimedia Commons (public domain)
The words differ from one ice sheet to another. That human activity influenced the melting of the Greenland ice sheet surface over the past 20 years is "very likely," while the influence of human activity on the Antarctic ice sheet losing ice is rated as "limited evidence, medium agreement" (DOI: 10.1017/9781009157896.001). Even for the same human influence, the evidence for Antarctica is still thin.
Confidence refers to how certain the IPCC is in its judgment, based on the quantity and quality of evidence and the degree of agreement among studies, and is written in grades like "high," "medium," and "low." The likelihood grade speaks to the probability that a judgment is correct, whereas confidence speaks to how solid the evidence supporting that judgment is. The "high confidence" regarding sea level rise speed that we saw earlier is precisely "high confidence."
There are also places where judgments genuinely diverge. According to a 2015 review, there are clear cases in many parts of the world where human influence has increased the probability of extremely hot seasons and decreased the probability of extremely cold seasons. For extreme rain, droughts, and storms, the evidence is mixed, and the regions and events covered by these analyses are still uneven (DOI: 10.1002/wcc.380).
Tropical cyclones, such as typhoons, require even more caution. Authors participating in a 2019 assessment were divided on whether human influence is clearly evident in the changes in tropical cyclones observed so far (DOI: 10.1175/bams-d-18-0189.1). Those are the places where the phrase "scientists themselves are divided" truly applies.
The judgment that the Earth has warmed and that human activity is the main cause is not one of those places. In a study classifying climate paper abstracts from 1991 to 2011, among abstracts that stated a position on the cause, 97.1% were on the side that humans are causing warming. About two-thirds of all abstracts did not state a position (DOI: 10.1088/1748-9326/8/2/024024).
The courtroom analogy has its limits. A courtroom chooses between guilty and not guilty, whereas this verdict writes down degrees of certainty across multiple steps. A courtroom looks for a single culprit, but here, multiple causes share the responsibility at the same time, and factors like aerosols that actually cooled the temperature are tallied together. Furthermore, the blame attached to the word "suspect" is absent here. What is being sorted out is the physical cause. The words in the verdict are markers that separate solid judgments from judgments that still remain a range.
How Much More — Climate Sensitivity
When proxies and climate models are combined and reconstructed, the Earth was on average 6.1 degrees colder at the depth of the last ice age, with a range of 5.7 to 6.5 degrees (DOI: 10.1038/s41586-020-2617-x).
Climate sensitivity is the amount the global average temperature rises when the climate reaches a new balance after atmospheric carbon dioxide doubles. The same study made assumptions about the size of the forces that greenhouse gases, ice sheets, and dust exerted on the climate, and translated this cooling into a climate sensitivity of 3.4 degrees, with a range of 2.4 to 4.5 degrees, which matches the long-standing consensus range of 2 to 4.5 degrees (DOI: 10.1038/s41586-020-2617-x).
A 2020 comprehensive assessment weighed three lines of evidence together: an understanding of how feedbacks work, the instrumental record of climate since industrialization, and paleoclimate records from the distant future. It was difficult to reconcile a climate sensitivity of less than 2 degrees with any of the three lines, and the magnitude of ice-age cooling strongly argued against values exceeding 4.5 degrees (DOI: 10.1029/2019rg000678).
The baseline 66% range produced by that assessment is 2.6 to 3.9 degrees, and the 5% to 95% range is 2.3 to 4.7 degrees (DOI: 10.1029/2019rg000678).
The range narrowed as its lower end rose compared to previous assessments, because the three lines of evidence were judged to be mutually consistent and largely independent of one another (DOI: 10.1029/2019rg000678). When three witnesses who have not coordinated their stories tell matching accounts, the range narrows. However, the assessment adds that widely drawn ranges like the 5% to 95% range should be viewed with greater caution, and when robustness tests are included, the ends of that range stretch from 2.0 to 5.7 degrees (DOI: 10.1029/2019rg000678).
Clouds are a major reason why an uncertainty range remains. A significant share of the spread in climate sensitivity across different models (2.1 to 4.7 degrees in a quadrupled carbon dioxide experiment) stems from differences in cloud feedback (DOI: 10.1029/2012gl051607), and clouds remain the most likely culprit in recent generations of models as well (DOI: 10.1126/sciadv.aba1981).
Climate sensitivity is not fixed as a single number, but is expressed as a range that the evidence has narrowed down.
The Future is a Conditional Statement
The sea level around the Korean Peninsula was calculated in a 2011 paper to rise by 27 centimeters and 31 centimeters over the 100 years from that point. These are the results of two climate models that plugged in an emission scenario called A1B (KCI ART001566441). This number comes attached to the condition "if A1B."
Emission scenarios are stories that assume in a few different directions how much greenhouse gas humans will put out from now on. It is not decided which of those paths humans will follow, and that is why the sea-level outlook for the end of this century is broad (Steven Earle, Physical Geology, 2nd Edition ch. 19.03). The fact that we still do not fully know how the large ice sheets of Greenland and Antarctica will respond to future warming also widens that range (Steven Earle, Physical Geology, 2nd Edition ch. 19.03).
The seas around the Korean Peninsula may move differently from the global average. In the previous calculation, when regional thermal expansion was included, the rate of rise in the Northwest Pacific and around the Korean Peninsula came out to up to twice the global average. These are the climate model results from the IPCC Fourth Assessment Report (KCI ART001566441).
Even if you pin the scenario down to one, the spread remains. At least half of the spread by which the 2005–2060 projection trends of previous-generation models diverged from one another was estimated to be due to internal variability (DOI: 10.1007/s00382-010-0977-x).
Typhoon projections are conditional statements as well. Authors who evaluated tropical cyclones picked it as their most confident projection that if human-caused warming is 2 degrees, storm surges will push seawater higher during storms due to sea-level rise, assuming other conditions remain the same. They placed at least medium-to-high confidence on the idea that the intensity of rainfall dropped by tropical cyclones will increase worldwide, and the median of the increase amounts yielded by those studies was 14%. Opinions were more divided on the projection that the total number of tropical cyclones worldwide will decrease (DOI: 10.1175/bams-d-18-0194.1). Numbers about the future are always inseparably bound to the condition "if a certain emission scenario occurs."
When You Put a Line of News on Trial
Let us put a single line of news—"the oceans are rising faster and faster, and human activity is the main driver"—on trial in this court. The foundation sentence goes like this. The rate of rise increased from 1.3 millimeters per year between 1901 and 1971 to 3.7 millimeters per year between 2006 and 2018, and at least since 1971, human influence is very likely the main driver of this increase (DOI: 10.1017/9781009157896.001).
First, the periods the witness compared are 1901–1971 and 2006–2018. Next is the range. The report attached a range of 3.2 to 4.2 millimeters next to the 3.7 millimeters (DOI: 10.1017/9781009157896.001).
Next are the words for the suspect and the verdict. The judgment of the cause comes with a timeframe, "at least since 1971," and the wording is "very likely." The judgment that the rate increased comes with a separate tag of "high confidence." If this timeframe and these two terms are dropped from a line of news, the exact same fact ends up sounding either weaker or stronger than it is.
Reading it this way filters out two misconceptions at once. To the claim that "the climate has always been changing, so this time it is also natural variation," the approximately 2,500 years of the oceans staying nearly in place responds, alongside an assessment that from 1850–1900 to 2010–2019, the shares altered by natural factors and internal variability each stopped at likely ranges of -0.1 to +0.1 degrees and -0.2 to +0.2 degrees. To the claim that "everything is settled with certainty," the climate sensitivity left as a range, the future that diverges depending on the scenario, and the Antarctic, where the evidence is still thin, respond.
Where to Look Next
The principles by which greenhouse gases trap heat and the measurement of atmospheric carbon dioxide continue in other parts of this series, The Carbon Cycle — Jars Buried in the Yard, a Winter Room with Sealed Door Gaps, and the difference between weather and climate and El Niño in Weather and Climate — Today's Roll, the Shape of the Die.
Examples of ice cores bearing witness even to human history are in Did Nature Bring Down the Western Roman Empire? — What Lead in Ice and Bacteria in Bones Can and Cannot Tell Us, and examples of reading ancient droughts through proxy indicators are in Did Drought Bring Down the Maya? — Setting the Record of the Weather Against the Record of the Cities. The story of matching the dates of volcanic eruptions continues in When Did the Thera Volcano Erupt? — The Century Between Carbon and Pottery.
The principles for dating ancient records are in Atoms and Radiation — A Drizzle That Never Stops, a Rain Gauge for How Wet We Get and Dating with Carbon — Radiocarbon Dates, Read with an Hourglass and Tree Rings, and the principles by which heat travels via radiation are in Heat and Temperature — Water That Only Flows Downhill, a Pump That Lifts It Back Up.
Supporting Papers
- "Summary for Policymakers" (2023) — DOI: 10.1017/9781009157896.001 — IPCC AR6 WGI Summary: From 2011 to 2020, Earth's surface temperature was 1.09 [0.95 to 1.20] degrees higher than 1850 to 1900 (land 1.59, ocean 0.88), with the highest increase per decade in the past 40 years. The rise since AR5 is primarily due to actual additional warming since 2003 to 2012 (+0.19) plus about 0.1 degrees from methodological improvements such as in the Arctic (not actual warming); human share 0.8 to 1.3 degrees (best estimate 1.07, likely), greenhouse gases 1.0 to 2.0, cooling from aerosols and others 0.0 to 0.8, natural -0.1 to +0.1, internal variability -0.2 to +0.2 (likely); greenhouse gases are the main driver of tropospheric warming since 1979 (very likely); upper ocean warming is virtually certain, with humans as the main driver (extremely likely); glacier retreat is very likely, Greenland surface melting is very likely, and the Antarctic ice sheet has limited evidence with medium agreement; sea level from 1901 to 2018 was 0.20 [0.15 to 0.25] meters, with the rate changing from 1.3 to 1.9 to 3.7 millimeters per year (high confidence), and humans are the main driver since 1971 (very likely).
- "Detection and Attribution of Climate Change: from Global to Regional" (2014) — DOI: 10.1017/cbo9781107415324.022 — More than half of the global average surface temperature increase from 1951 to 2010 is very likely due to greenhouse gases increased by humans; the sun is the only known natural warming forcing during this period but has increased much less than greenhouse gases, and the patterns of tropospheric warming and stratospheric cooling do not match solar response.
- "Evaluation of Climate Models" (2014) — DOI: 10.1017/cbo9781107415324.020 — Climate models are evaluated against observations by reproducing past climate and variability; the ability to simulate surface temperature has improved in many, but not all, aspects.
- "The Detection and Attribution Model Intercomparison Project (DAMIP v1.0) contribution to CMIP6" (2016) — DOI: 10.5194/gmd-9-3685-2016 — Detection and attribution use unforced control simulations, all-forcing simulations, and single-forcing simulations such as for aerosols, solar, volcanic, and CO2, which help estimate human and natural shares.
- "Tropical Cyclones and Climate Change Assessment: Part I: Detection and Attribution" (2019) — DOI: 10.1175/bams-d-18-0189.1 — Detection means very rare compared to expected natural variability; the author team is divided on whether human influence is apparent in observed tropical cyclone changes.
- "Tropical Cyclones and Climate Change Assessment: Part II: Projected Response to Anthropogenic Warming" (2019) — DOI: 10.1175/bams-d-18-0194.1 — Under a human-caused 2-degree warming condition, the most confident projection is an increase in storm surge height due to sea level rise (assuming other conditions remain constant), with at least medium to high confidence for an increase in global tropical cyclone precipitation rate (median projection +14%), while opinions are more divided on decreases in frequency and other aspects.
- "Attribution of extreme weather and climate‐related events" (2015) — DOI: 10.1002/wcc.380 — There is clear evidence that human influence has increased the probability of extremely warm seasonal temperatures and decreased the cold side, while evidence for extreme precipitation, drought, and storms is mixed.
- "Quantifying the consensus on anthropogenic global warming in the scientific literature" (2013) — DOI: 10.1088/1748-9326/8/2/024024 — Of 11,944 abstracts from 1991 to 2011, 66.4% stated no position, and 97.1% of the abstracts that stated a position endorsed human causes (confirmed to be original research, not reviews).
- "Improvements to NOAA’s Historical Merged Land–Ocean Surface Temperature Analysis (1880–2006)" (2008) — DOI: 10.1175/2007jcli2100.1 — An analysis combining land and ocean temperature anomalies into monthly 5-degree grids; uncertainty arises from data errors and incomplete sampling, including bias-corrected satellite data from 1985 onward.
- "GLOBAL SURFACE TEMPERATURE CHANGE" (2010) — DOI: 10.1029/2010rg000345 — GISS analysis: urban station trends are corrected using satellite nighttime lights, showing that urban effects are small; sensitive to polar regions with sparse observations; captures year-to-year fluctuations driven by the El Niño–Southern Oscillation cycle (confirmed to be original research, not reviews).
- "Revision of the EPICA Dome C CO 2 record from 800 to 600 kyr before present" (2014) — DOI: 10.1002/2014gl061957 — 800,000-year CO2 record from Dome C; an analytical error of up to 10.1±2.4 parts per million was found and corrected in the deepest section, resolving only part of the CO2–temperature relationship problem in the oldest interval.
- "Stable Carbon Cycle–Climate Relationship During the Late Pleistocene" (2005) — DOI: 10.1126/science.1120130 — Extended the Vostok record to 650,000 years, suggesting that before 430,000 years ago, CO2 was 180 to 260 parts per million and the CO2–Antarctic temperature relationship remained nearly constant over six glacial cycles.
- "Natural and anthropogenic changes in atmospheric CO2 over the last 1000 years from air in Antarctic ice and firn" (1996) — DOI: 10.1029/95jd03410 — Law Dome record from 1006 to 1978, showing pre-industrial levels of 275 to 284 parts per million, making it inappropriate to cite a single pre-industrial value due to natural variability.
- "Law Dome CO 2 , CH 4 and N 2 O ice core records extended to 2000 years BP" (2006) — DOI: 10.1029/2006gl026152 — Large increases in CO2, CH4, and N2O over the past 200 years following a relatively stable period.
- "Historical greenhouse gas concentrations for climate modelling (CMIP6)" (2017) — DOI: 10.5194/gmd-10-2057-2017 — Greenhouse gas concentrations are at unprecedentedly high levels compared to the past 800,000 years; the 1850 global annual average CO2 is estimated at 284.3 parts per million.
- "Sea level and global ice volumes from the Last Glacial Maximum to the Holocene" (2014) — DOI: 10.1073/pnas.1411762111 — Inversion of about 1,000 observations: dropped to -134 meters about 29,000 to 21,000 years ago, remained nearly constant from about 2,500 years ago until rising again 100 to 150 years ago, with no evidence of oscillations exceeding 15 to 20 centimeters over intervals longer than 200 years between 6,000 and 150 years ago.
- "Atmospheric CO 2 Concentrations over the Last Glacial Termination" (2001) — DOI: 10.1126/science.291.5501.112 — CO2 increased by 76 parts per million over the 6,000 years of the last glacial termination (reported by original research, confirmed not a review).
- "Ice Age Terminations" (2009) — DOI: 10.1126/science.1177840 — Matched four glacial terminations using speleothem records from Sanbao Cave in China: consistent with the explanation of a northern hemisphere summer insolation trigger, with subsequent increases in CO2 and Antarctic temperature driving the southern hemisphere termination.
- "Uncertainty in climate change projections: the role of internal variability" (2010) — DOI: 10.1007/s00382-010-0977-x — 40-member ensemble: internal variability accounts for at least half of the inter-model spread in projected trends for 2005 to 2060 in CMIP3; temperature changes are detected earlier and with fewer repetitions than circulation or precipitation.
- "Glacial cooling and climate sensitivity revisited" (2020) — DOI: 10.1038/s41586-020-2617-x — Proxy data plus model data assimilation: Last Glacial Maximum cooling of -6.1 degrees (95% -6.5 to -5.7), climate sensitivity of 3.4 degrees (2.4 to 4.5) assuming forcings, consistent with the traditional consensus range of 2 to 4.5 degrees.
- "An Assessment of Earth's Climate Sensitivity Using Multiple Lines of Evidence" (2020) — DOI: 10.1029/2019rg000678 — Three lines of evidence—feedback understanding, historical records, and paleoclimate: values below 2K are difficult to reconcile with any of the three, and glacial cooling provides strong counter-evidence against values exceeding 4.5K; the baseline 66% range is 2.6 to 3.9K, with 5% to 95% at 2.3 to 4.7K (high-confidence ranges are more cautious), narrowed down through the consistency and independence of the three lines (original comprehensive assessment paper, confirmed not a review).
- "Forcing, feedbacks and climate sensitivity in CMIP5 coupled atmosphere‐ocean climate models" (2012) — DOI: 10.1029/2012gl051607 — In a quadrupled CO2 experiment, CMIP5 climate sensitivity ranges from 2.1 to 4.7K, with cloud feedback differences making a major contribution.
- "Context for interpreting equilibrium climate sensitivity and transient climate response from the CMIP6 Earth system models" (2020) — DOI: 10.1126/sciadv.aba1981 — The most likely causes of the higher values and wider spread in CMIP6 are cloud feedbacks and cloud-aerosol interactions.
- "지구온난화에 의한 북서태평양 및 한반도 근해의 해수면 상승" (2011) — KCI ART001566441 — IPCC AR4 models show that considering regional thermal expansion, the rate of sea level rise in the Northwest Pacific and coastal waters around the Korean Peninsula is up to twice the global average; two models under the A1B scenario project a rise of 27 centimeters and 31 centimeters respectively in Korean coastal waters over 100 years.
- "Biology 2e — 44.5 Climate and the Effects of Global Climate Change" (2018) — OpenStax Biology 2e 44.5 — Climate is the average weather over many years; air trapped in ice cores and bubbles; indirect evidence (tree rings, pollen, sediments); the relationship between solar intensity and temperature.
- "Physical Geology, 2nd Edition — 19.01 What Makes the Climate Change?" (2026) — Steven Earle, Physical Geology, 2nd Edition ch. 19.01 — Forcings and feedbacks, orbital cycles, short-term cooling from volcanic sulfur dioxide aerosols, 2- to 7-year ENSO fluctuations, and global high temperatures during strong El Niño years.
- "Physical Geology, 2nd Edition — 19.02 Anthropogenic Climate Change" (2026) — Steven Earle, Physical Geology, 2nd Edition ch. 19.02 — The IPCC was established by the United Nations in 1988 to review and report on climate change literature.
- "Physical Geology, 2nd Edition — 19.03 Implications of Climate Change" (2026) — Steven Earle, Physical Geology, 2nd Edition ch. 19.03 — Two causes of sea level rise (expansion of seawater and land ice), with floating ice making no direct contribution; end-of-century projections have a wide spread because it is uncertain which scenario will be followed, and understanding of ice sheet response is weak.
Sources (27)
- Summary for PolicymakersDOI 10.1017/9781009157896.001
- Detection and Attribution of Climate Change: from Global to RegionalDOI 10.1017/cbo9781107415324.022
- Evaluation of Climate ModelsDOI 10.1017/cbo9781107415324.020
- The Detection and Attribution Model Intercomparison Project (DAMIP v1.0) contribution to CMIP6DOI 10.5194/gmd-9-3685-2016
- Tropical Cyclones and Climate Change Assessment: Part I: Detection and AttributionDOI 10.1175/bams-d-18-0189.1
- Tropical Cyclones and Climate Change Assessment: Part II: Projected Response to Anthropogenic WarmingDOI 10.1175/bams-d-18-0194.1
- Attribution of extreme weather and climate‐related eventsDOI 10.1002/wcc.380
- Quantifying the consensus on anthropogenic global warming in the scientific literatureDOI 10.1088/1748-9326/8/2/024024
- Improvements to NOAA’s Historical Merged Land–Ocean Surface Temperature Analysis (1880–2006)DOI 10.1175/2007jcli2100.1
- GLOBAL SURFACE TEMPERATURE CHANGEDOI 10.1029/2010rg000345
- Revision of the EPICA Dome C CO 2 record from 800 to 600 kyr before presentDOI 10.1002/2014gl061957
- Stable Carbon Cycle–Climate Relationship During the Late PleistoceneDOI 10.1126/science.1120130
- Natural and anthropogenic changes in atmospheric CO2 over the last 1000 years from air in Antarctic ice and firnDOI 10.1029/95jd03410
- Law Dome CO 2 , CH 4 and N 2 O ice core records extended to 2000 years BPDOI 10.1029/2006gl026152
- Historical greenhouse gas concentrations for climate modelling (CMIP6)DOI 10.5194/gmd-10-2057-2017
- Sea level and global ice volumes from the Last Glacial Maximum to the HoloceneDOI 10.1073/pnas.1411762111
- Atmospheric CO 2 Concentrations over the Last Glacial TerminationDOI 10.1126/science.291.5501.112
- Ice Age TerminationsDOI 10.1126/science.1177840
- Uncertainty in climate change projections: the role of internal variabilityDOI 10.1007/s00382-010-0977-x
- Glacial cooling and climate sensitivity revisitedDOI 10.1038/s41586-020-2617-x
- An Assessment of Earth's Climate Sensitivity Using Multiple Lines of EvidenceDOI 10.1029/2019rg000678
- Forcing, feedbacks and climate sensitivity in CMIP5 coupled atmosphere‐ocean climate modelsDOI 10.1029/2012gl051607
- Context for interpreting equilibrium climate sensitivity and transient climate response from the CMIP6 Earth system modelsDOI 10.1126/sciadv.aba1981
- Biology 2e — 44.5 Climate and the Effects of Global Climate Change
- Physical Geology, 2nd Edition — 19.01 What Makes the Climate Change?
- Physical Geology, 2nd Edition — 19.02 Anthropogenic Climate Change
- Physical Geology, 2nd Edition — 19.03 Implications of Climate Change