Paperis Articles
Van Gogh's The Starry Night — One Sky, Measured Three Times
Do the swirls in the sky van Gogh painted in 1889 follow the laws of turbulence? A 2019 preprint and papers from 2020 and 2024 measured the slope of the painting's brightness, broken down by size, and got about −2.1, −1 and a value close to −5/3. A two-page rebuttal answered the 2024 result, and one essay argues that a slope alone cannot settle whether a painting captures turbulence. We follow, side by side, where and how each measurement was taken.
Your field's papers, as audio
Pick your fields and journals — Paperis summarizes the key papers and turns them into audio. Listen on your commute.
Start Paperis free →Van Gogh's The Starry Night — One Sky, Measured Three Times
June 1889, The Window at Saint-Rémy
In June 1889, in the small southern French town of Saint-Rémy-de-Provence. The Dutch painter Vincent van Gogh was staying at an asylum there and painting. That month, he painted a night sky on canvas in oil. Below, a small village with a church spire sleeps, a cypress tree rises upward like a flame in the front left, and the sky above it occupies most of the canvas. This painting, titled "The Starry Night," now hangs in the Museum of Modern Art in New York, USA.
This article asks a single question of this painting. Whether the swirls spinning in the sky follow the laws of how water and air actually tumble and flow together. From 2019 to 2025, researchers tried to answer this question with numbers, and those answers did not converge. Studies that measured the brightness of the same sky with the same kind of yardstick yielded different numbers, and the places in the painting and the size ranges those studies used were not the same either.
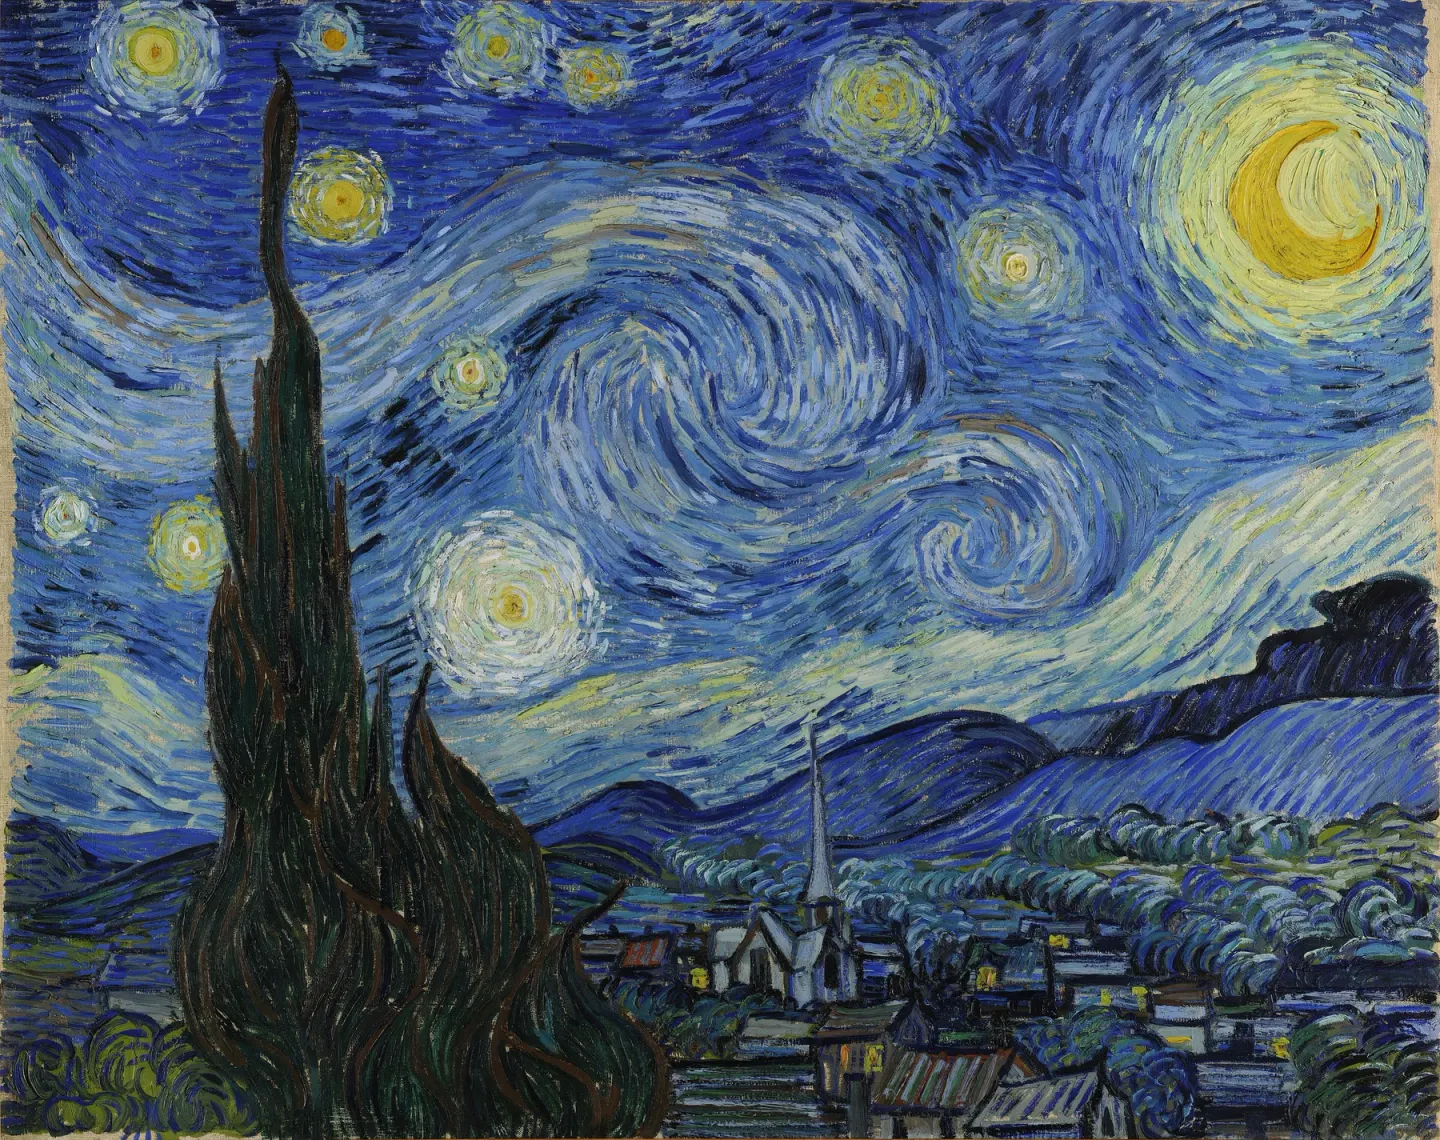
Vincent van Gogh, The Starry Night (1889) · Museum of Modern Art, New York · public domain · Wikimedia Commons (Google Arts & Culture)
This Place in the Sky
If you look at the upper middle of the screen, two large vortices are interlocked and coiled together. Around them, stars are each wrapped in round halos of light, and in the upper right corner, a crescent moon floats in the middle of a halo of light. The sky is filled with a grain formed by short, thick brushstrokes lined up in the same direction. When you get closer, you can see that even a single vortex is a flow made of numerous small brushstrokes. Inside the large vortex are smaller grains, and inside those grains are even smaller brushstrokes layered over one another.
Turbulence is a state where water or air flows irregularly, tangled into large and small vortices. The swirling night sky in this painting has long been interpreted as a depiction of turbulence, and the story that this painting captures, even by coincidence, the numerical rules of actual turbulence by scale has been widely repeated. A 2020 paper calls this story a "popular myth" (DOI: 10.1080/14685248.2020.1718158). A 2024 study notes that a long debate has continued over whether the flow patterns in this painting follow the theory of turbulence (DOI: 10.1063/5.0213627). The paintings Vincent van Gogh drew in his later years are famous for their seemingly moving grains, and there is also the evaluation that the swirling pattern and the places where light and dark contrast recall the movement of turbulence (DOI: 10.1063/5.0307352).
The question the researchers asked was to measure this impression with numbers. If the feeling that the painting looks like turbulence is measured using the method for measuring actual turbulence, what comes out? That method starts from one rule that turbulence follows.
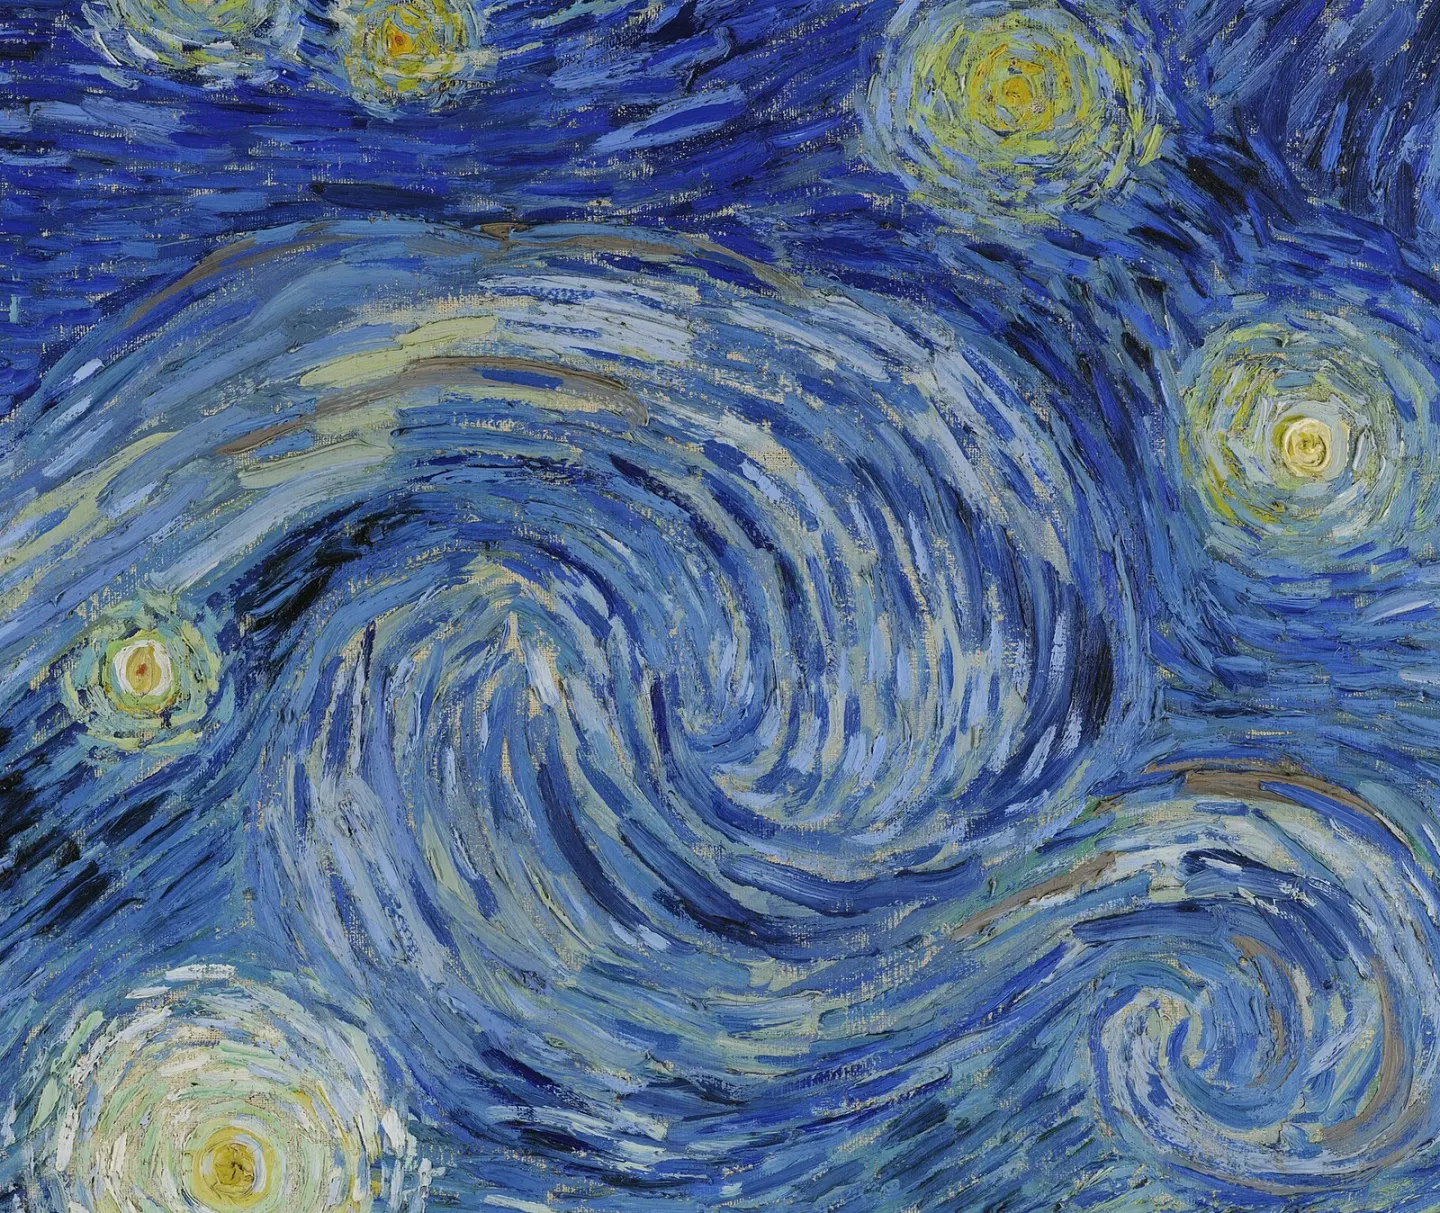
Detail · Vincent van Gogh, The Starry Night (1889) · Museum of Modern Art, New York · public domain · Wikimedia Commons (Google Arts & Culture)
Small Whirlpools Inside a Big Whirlpool
When a stream flows around a rock, a whirlpool forms behind the rock, and smaller whirlpools rise and vanish at the edge of that whirlpool. That tangled water behind the rock is turbulence. The whirlpools inside turbulence come in all different sizes, and those sizes are linked in a steady relationship.
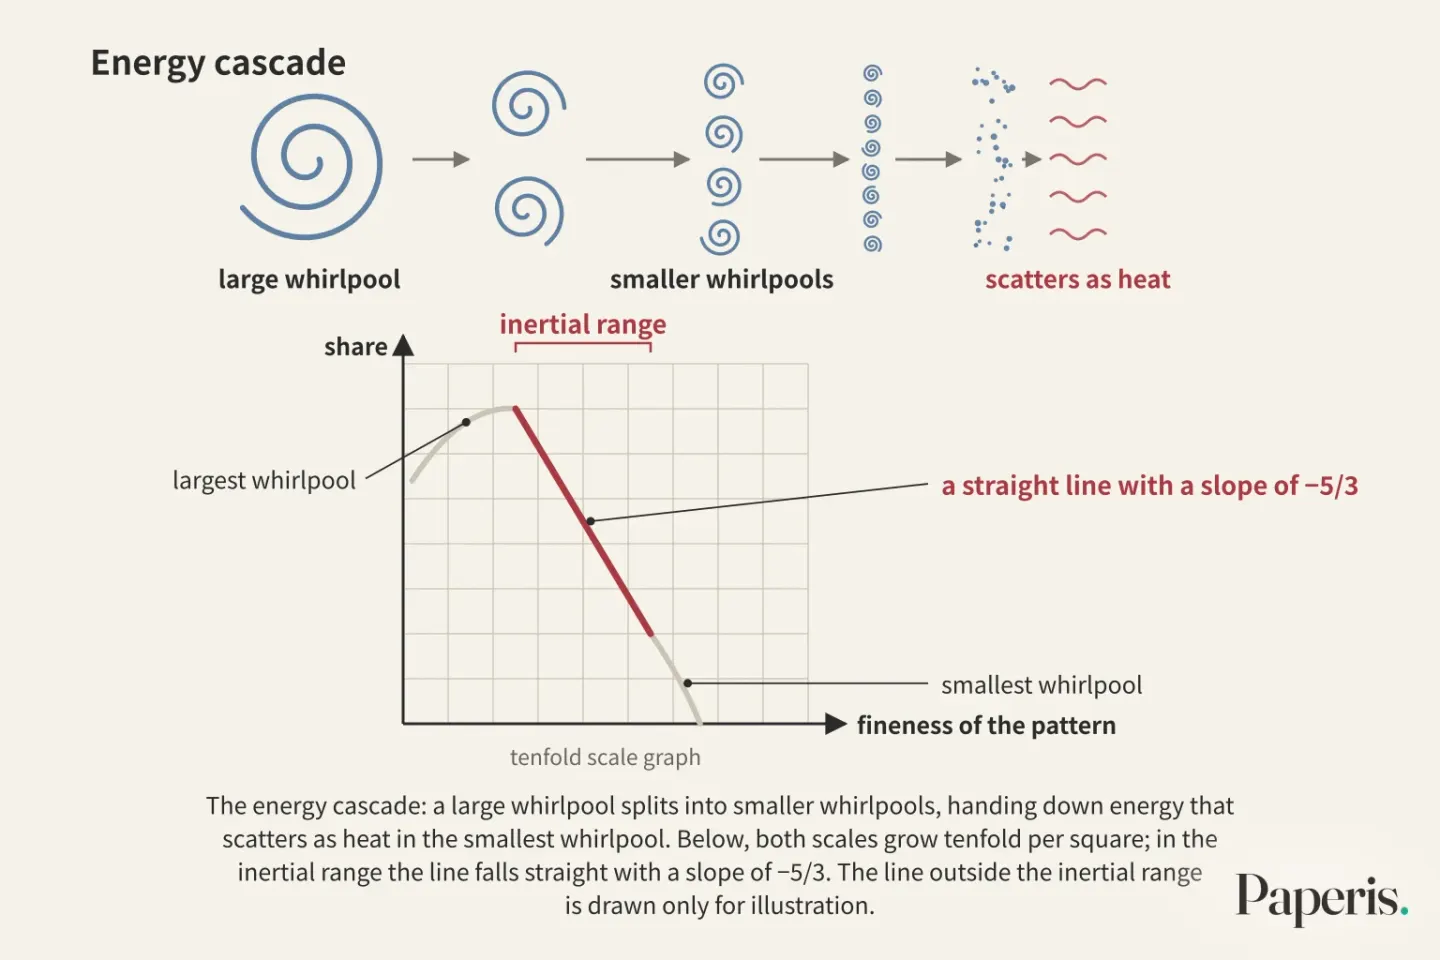
The picture physics has used for a long time goes like this: The energy cascade is a process where a large whirlpool splits into smaller whirlpools, handing down the energy of motion in turn, and that energy scatters as heat in the smallest whirlpool. It is a sight where a large whirlpool contains a smaller one inside it, and an even smaller one inside that, layer upon layer. A 2024 study followed this cascade picture when it analyzed this picture (DOI: 10.1063/5.0213627).
Between both ends of the cascade lies a middle stretch. The inertial range is the middle size range between the largest whirlpool that takes in energy and the smallest whirlpool where energy scatters as heat. In the inertial range, there is a rule between the size of a whirlpool and the share of fluctuation that size holds.
That rule is read from a table broken down by size. The power spectrum is an arrangement where the fluctuations of a flow or a picture are divided into patterns by size, laying out how much the pattern of each size takes up of the total fluctuation. If you draw this as a graph, the horizontal axis is the fineness of the pattern, and the further to the right you go, the finer the pattern gets. The vertical axis is the share that the pattern of that size takes up. If you plot both scales while increasing them by tenfold each in the same way, the points in the inertial range lie on a single straight line sloping down to the bottom right.
Soviet mathematician Andrey Kolmogorov put forth a rule about the steepness of this line in 1941 (DOI: 10.1080/14685248.2025.2477244). The Kolmogorov law is a law stating that in the inertial range of turbulence, if you plot the shares of flow fluctuation broken down by size on a tenfold scale graph, it descends as a straight line with a slope of −5/3. This number is read as minus five-thirds, and it means that when that line goes three squares horizontally, it descends five squares vertically. A slope of −1 is gentler at one square down for one across, and a slope of −2 is steeper at two squares down for one across. All the numbers appearing in this article are slopes like this.
The slope also varies depending on the type of flow. In compressible turbulence where the gas flows fast enough to be pressed down and spread back out, the slope lies between −5/3 and −2, and that value changes depending on how fast the flow is compared to sound (DOI: 10.1080/14685248.2020.1718158).
There is no flowing water in a painting. What the researchers measure is the brightness of the painting. If you turn a painting to grayscale, a single brightness value remains at each spot on the screen. A comment written by other researchers—in other words, a short piece written about a single paper—was attached to the 2024 study. That comment summarizes the method of the 2024 study like this: it analyzed the painting as a grayscale image, and assumed that image was a scalar field inside a flow assumed to be turbulence, meaning a distribution where a single value is assigned to each spot (DOI: 10.1063/5.0306945).
A passive scalar is a quantity like ink dropped in water or temperature in air that merely gets carried along by a flow without changing the flow itself. If you view the brightness of a painting as a quantity like this, the standard to compare it to becomes the law for quantities carried along by a flow. Former Soviet physicist Aleksandr Obukhov and American physicist Stanley Corrsin expanded Kolmogorov's theory to quantities like this (DOI: 10.1063/5.0306945). In the resulting "Obukhov–Corrsin spectrum", the fluctuations of the passive scalar also follow a slope of −5/3 at the size corresponding to the inertial range (DOI: 10.1063/5.0259486).
What studies measuring paintings are trying to confirm is whether the steepness at which a painting's brightness fluctuations shrink according to size is the same as the steepness of turbulence. The stage for this debate is ultimately a single number: the slope.
Three Measurements
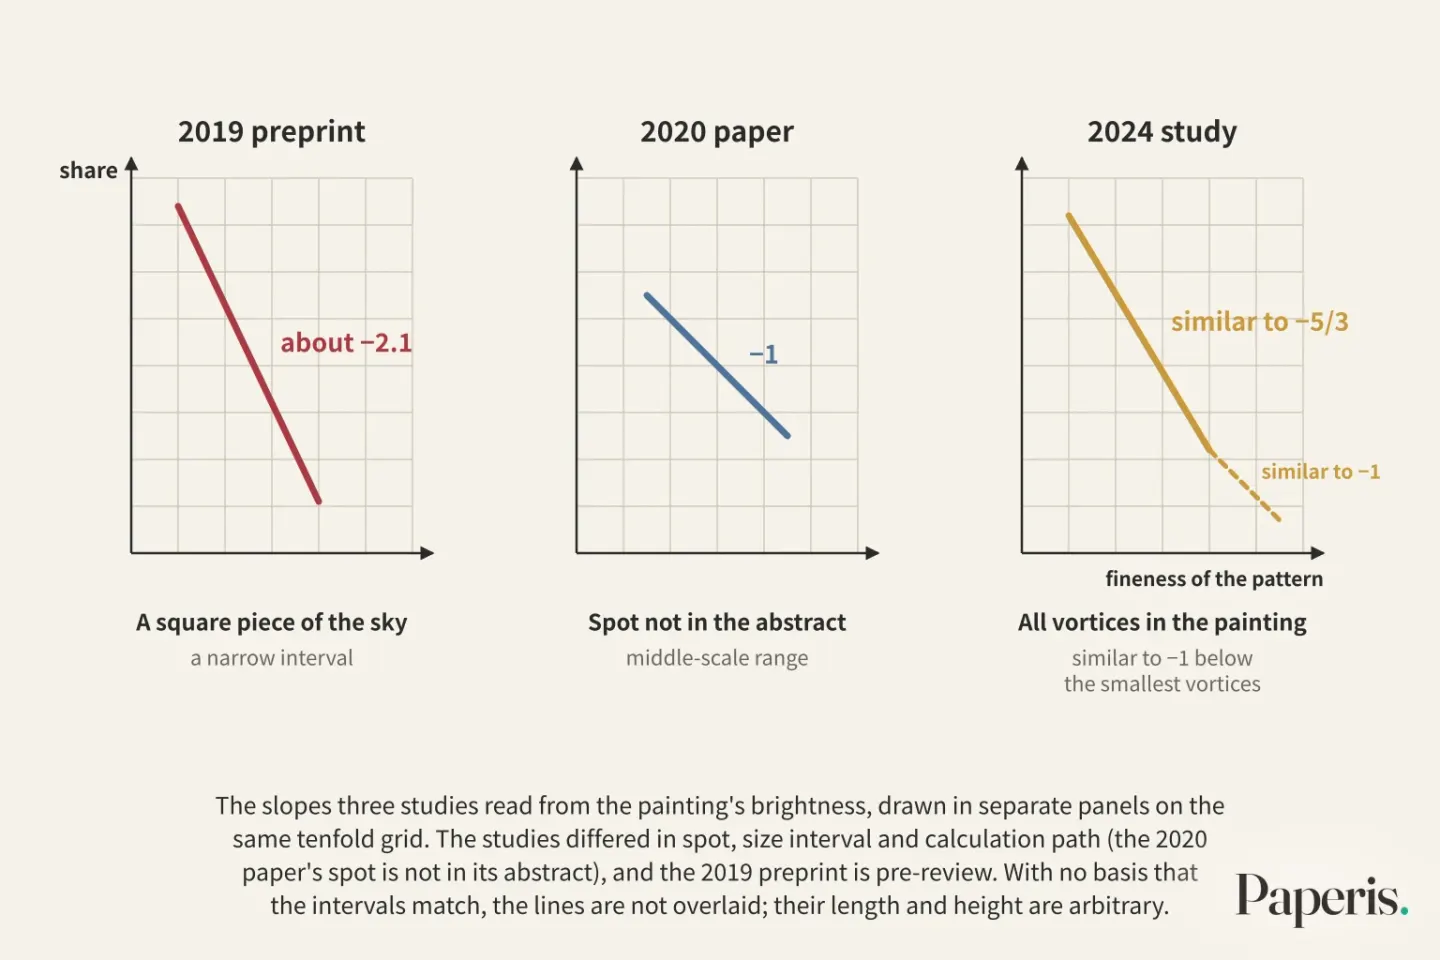
The first measurement was made on a square piece detached from the sky. In 2019, a preprint bearing this exact question as its title was posted on arXiv, a repository where manuscripts are uploaded before peer review. "Is Starry Night Turbulence?" The authors detached a square piece of 1,165 by 1,165 pixels from the night sky of the painting and calculated the power spectrum averaged in all directions. In one range between the scale where energy enters and the scale where it dissipates into heat, the slope was about −2.1 with an error of 0.3 up and down. The authors pointed out the scales where energy enters and dissipates, as well as a feature they called a "bottleneck," and reported that this spectrum possessed features like supersonic turbulence. They wrote that this result led them to see the night sky painted by Van Gogh as very similar to actual turbulence in molecular clouds, which are places in space where stars are born (DOI: 10.48550/arxiv.1902.03381). This is the result of a pre-review manuscript. Although it was not a comparison made by the authors in 2019, if we compare this to the range of compressible turbulence written in a 2020 paper, −5/3 to −2, −1 is just beyond its steep end, and adding the 0.3 error puts it within that range. Being steeper than −5/3 means that as the patterns become finer, their share decreases faster than Kolmogorov's slope.
A year later, in 2020, a paper published in an academic journal measured the same brightness through a different calculation path. The authors measured how similar two spots of brightness in the painting's brightness were at various distances, and unpacked that value into shares by scale to look at the slope in the middle-scale range. This paper describes Kolmogorov's law as the slope of this "two-spot similarity" measured in flow velocity, and measured the same thing in the painting's brightness. The result was −1. It was neither −5/3 for non-compressed turbulence, nor between −5/3 and −2 for compressible turbulence. The authors also examined several other paintings by Van Gogh and multiple paintings by Impressionist painters, and slopes matching turbulence did not appear in those paintings either. The authors' conclusion is that this painting does not accurately capture one of the most fundamental characteristics of turbulence, and that therefore the foundation for the widely repeated conventional wisdom that this painting mathematically accurately captures turbulence is weakened (DOI: 10.1080/14685248.2020.1718158). The abstract of this paper does not disclose which range of the painting was used. −1 is a gentler slope than −5/3. This means that even as the patterns become finer, their share decreases less, so a larger share remains on the side of fine patterns in the same interval compared to the line drawn by Kolmogorov's slope.
In 2024, another research team made a third measurement. Pointing out that previous studies only looked at parts of the painting, this research team followed the energy cascade picture and analyzed all the vortices in the painting, selecting only the vortices. The research team reports that a slope close to −5/3 then appeared naturally in the power spectrum of brightness. Their interpretation is that not only the size of the vortices, but also the distance between vortices and their intensity follow the physical laws governing turbulence. Going down to finer scales than the smallest vortices, a slope similar to −1 continued, and the researchers view this as possibly a trace of "Batchelor-type" turbulence appearing in quantities carried along by the flow. They write that this result suggests Van Gogh observed actual flows very carefully, and conclude that this study revealed hidden turbulence contained in the painting (DOI: 10.1063/5.0213627).
Placing the three measurements side by side looks like this.
| Research | Nature | Which spot and which size interval of the painting | Slope | Authors' Conclusion |
|---|---|---|---|---|
| 2019 (DOI: 10.48550/arxiv.1902.03381) | arXiv preprint (pre-review) | A square piece of the sky, averaged in all directions, a narrow interval | About −2.1 | Possessed features of supersonic turbulence, and led to seeing it as very similar to turbulence in molecular clouds |
| 2020 (DOI: 10.1080/14685248.2020.1718158) | Journal paper | Spot not in the abstract, middle-scale range unpacking two-spot brightness similarity by scale, along with other paintings | −1 | Does not accurately capture the most fundamental characteristics of turbulence, and the foundation of the conventional wisdom that it “mathematically accurately captured it” is weakened |
| 2024 (DOI: 10.1063/5.0213627) | Journal paper | All vortices in the painting, vortices only | Similar to −5/3 (similar to −1 below the smallest vortices) | Suggests very careful observation of actual flows, and revealed hidden turbulence |
All three studies measured the slope of the share obtained by dividing the painting's brightness by scale, but the spot and size interval in the painting (the 2020 paper does not have the spot in its abstract) and the calculation path were not the same, and the numbers were also different at values similar to −2.1, −1, and −5/3. Whether the −1 measured by the 2020 paper in the middle scale and the slope similar to −1 seen by the 2024 study below the smallest vortices point to patterns of the same size cannot be known from the two abstracts alone. When reading numbers, one must read together which spot and which size interval in the painting those numbers came from.
Is a Single Slope Enough?
"Completely unfounded." That is the verdict handed down by a two-page short rebuttal published in 2025 on the conclusions of a 2024 study. This rebuttal summarizes that the study claimed to have discovered hidden turbulence in paintings, and even asserted that the paintings fit the framework extending Kolmogorov's theory by Obukhov and Korshin, before ruling on those conclusions in that manner (DOI: 10.1080/14685248.2025.2477244). The reasons for seeing it that way are not written in the abstract. A comment summarizing the method earlier cuts off at the point where the abstract tries to relay the conclusions of the 2024 study, so the comment's own judgment is not carried in the abstract (DOI: 10.1063/5.0306945).
The rebuttal that leaves the reasons in the abstract is an essay published in the Bulletin of the American Meteorological Society. The authors of the essay summarize that a recent study reached its conclusion by comparing the spectrum slope of a painting to Kolmogorov's −5/3, and view that match as a coincidence and anecdotal. Their argument is that looking at the slope alone is not enough to say whether a painting, or any other image for that matter, accurately captures Kolmogorov-style turbulence. Citing French painter Edgar Degas's "Woman Sitting Beside a Vase of Flowers", the authors argue that if judged by the slope alone, even that painting would have to be concluded to have accurately painted turbulence. This is the title and thesis of the essay (DOI: 10.1175/bams-d-25-0004.1). The gist of the rebuttal put forward by the essay is that the slope matching the value of turbulence alone does not allow us to say that a painting contains turbulence.
The same year, another research team, stimulated by the 2024 study, applied the same tools to a different painting. It is the folding screen painting "Red and White Plum Blossoms" by Edo-period Japanese painter Ogata Korin. The research team reports that not only the swirling patterns of water flowing between two trees, a red plum and a white plum, but also the bark patterns on the trunks of the plum trees are close to Obukhov and Korshin's −5/3. Even in a stricter test measuring the degree to which fluctuations cluster in patches, the values came out nearly identical to the rules appearing in passive scalars. The research team discusses several possibilities that could explain this match (DOI: 10.1063/5.0259486).
When Measuring the Same Sky Three Times
We stand before the painting and follow the three measurements in turn. All three unpack the painting's brightness into shares by size and read the slope. The first is a 2019 preprint. It cuts a square piece from the sky, averages the brightness inside it in all directions, and reads the slope of one section. The number is roughly −2.1, and the authors thought of supersonic turbulence and molecular clouds where stars are born (DOI: 10.48550/arxiv.1902.03381).
The second is a 2020 paper. It measures how similar two spots of brightness are across distances and reads the mid-sized slope. The number is −1, and the authors saw this as not matching the number for turbulence (DOI: 10.1080/14685248.2020.1718158). The third is a 2024 study. It picks out all the swirls in the painting and leaves the outside out of the count. The number is a value close to −5/3, and when going down to finer sizes than the smallest swirl, a slope close to −1 continues (DOI: 10.1063/5.0213627).
All three times it is the same brushstroke, the same paint, the same sky. What changed is where was cut out (the 2020 paper has no range in its abstract), which size range was read through which calculation path, and what those numbers were compared against.
Remaining Questions
In 2024, the researchers wrote that their results "suggest that Van Gogh observed actual flows very carefully" (DOI: 10.1063/5.0213627). That sentence is the interpretation the authors made of the measurement results. The authors of the 2020 paper consider that their results weaken the foundation of the common belief that this painting captures turbulence with mathematical accuracy (DOI: 10.1080/14685248.2020.1718158).
There are also studies that expanded the methods for measuring turbulence to several of Van Gogh's late paintings. A 2025 paper noted that there had not yet been a systematic measurement of visual complexity across Van Gogh's later works, and measured how uneven the fluctuations in brightness were by position and scale across four major paintings Van Gogh painted during the last 15 months of his life (DOI: 10.1063/5.0307352). Distinct differences emerged from each painting, and the authors report that paintings from periods recorded historically and psychologically as unstable showed more uneven fluctuations, while paintings from relatively calm periods showed more even rules. This is the result of comparing four paintings, and "unstable" and "calm" are distinctions the authors attached by relying on historical records. The authors conclude by proposing an index that summarizes this difference into one, and showing that methods created for turbulence can be expanded to human-made images.
What the evidence says goes only as far as the fact that different studies obtained different slopes from the brightness of the same sky. The 2024 research team pointed out that previous studies looked at only a portion of the painting, but the evidence gathered by this article does not divide why the numbers diverged. The results of the 2024 study and the conclusion that it "revealed hidden turbulence" have been met with counterarguments. The stories connecting the painter's life and work are covered in "Genius and Madness — The Thin Sheet Between Them". How the paint itself changes in other paintings by the same Van Gogh is continued in "Van Gogh's Sunflowers — The Shadow Settling on the Yellow".
Source Papers
- "Hidden turbulence in van Gogh's The Starry Night" (2024) — DOI: 10.1063/5.0213627 — Arguing that previous studies looked at only part of the painting, it follows an energy cascade drawing to analyze all swirls and only swirls, finding a brightness power spectrum with a slope close to −5/3, with swirl size, distance, and strength also following rules, and below the smallest swirl a −1 (suggesting a Batchelor type). Authors' interpretation: suggests van Gogh carefully observed real flow, revealing hidden turbulence.
- "Is The Starry Night Turbulent?" (2019) — DOI: 10.48550/arxiv.1902.03381 — arXiv preprint. Directionally averaged power spectrum of a 1165×1165-pixel square of the night sky, −2.1±0.3 in a narrow interval, with driving and dissipation sizes and a bottleneck. Authors: shares features with supersonic turbulence, leading us to see it as very similar to the turbulence of molecular clouds.
- "The midrange wavenumber spectrum of van Gogh's Starry Night does not obey a turbulent inertial range scaling law" (2020) — DOI: 10.1080/14685248.2020.1718158 — Mid-size spectrum slope of −1 for a brightness two-point correlation, differing from incompressible −5/3 and compressible −5/3 to −2, with other van Gogh and Impressionist paintings also failing to fit. Authors' conclusion: does not accurately capture the basic features of turbulence, weakening the foundation of the conventional wisdom that it "mathematically captures it accurately."
- "Is there hidden turbulence in Vincent van Gogh's The Starry Night ?" (2025) — DOI: 10.1080/14685248.2025.2477244 — A two-and-a-half-page rebuttal targeting the 2024 study. Claims that finding hidden turbulence and matching the Obukhov-Corrsin extension are "completely unfounded." The reason is not in the abstract. References Kolmogorov 1941.
- "Comment on 'Hidden turbulence in van Gogh's The Starry Night'" (2025) — DOI: 10.1063/5.0306945 — Comment. Summarizes that the 2024 study viewed the grayscale image as a scalar field in assumed turbulence and analyzed it using structure functions and power spectra (the framework expanding Kolmogorov's theory to scalars by Obukhov and Corrsin). The comment's own judgment is not in the abstract.
- "If van Gogh's The Starry Night Depicts Perfect Turbulence, So Should Degas' A Woman Seated beside a Vase of Flowers" (2025) — DOI: 10.1175/bams-d-25-0004.1 — Essay. The slope match in a recent study is coincidental and anecdotal, and slope alone is insufficient to say whether Kolmogorov-style turbulence is captured, or else Degas's painting must also be said to have accurately painted turbulence.
- "Turbulent scaling law in Ogata Kōrin's Red and White Plum Blossoms" (2025) — DOI: 10.1063/5.0259486 — Prompted by the 2024 study, analyzing the swirl patterns and plum branch bark in Kōrin's "Red and White Plum Blossoms", finding it close to Obukhov–Corrsin −5/3 with 4th and 6th-order structure functions also nearly identical to the intermittent rules of a passive scalar, and discussing possible explanations for the match.
- "Multifractal luminance and aesthetic complexity in van Gogh's paintings" (2025) — DOI: 10.1063/5.0307352 — Reporting that no study had systematically measured visual complexity across late works, two-dimensional multifractal analysis was applied to four major paintings from the final 15 months, showing differences between paintings, with the authors reporting that paintings from periods historically recorded as having psychological instability show a wider spectrum. Conclusion: proposing a "fractal turbulence index," showing that methods for turbulence can be extended to human-made images.
Sources (8)
- Hidden turbulence in van Gogh's The Starry NightDOI 10.1063/5.0213627
- Is The Starry Night Turbulent?DOI 10.48550/arxiv.1902.03381
- The midrange wavenumber spectrum of van Gogh's Starry Night does not obey a turbulent inertial range scaling lawDOI 10.1080/14685248.2020.1718158
- Is there hidden turbulence in Vincent van Gogh's The Starry Night ?DOI 10.1080/14685248.2025.2477244
- Comment on 'Hidden turbulence in van Gogh's The Starry Night'DOI 10.1063/5.0306945
- If van Gogh's The Starry Night Depicts Perfect Turbulence, So Should Degas' A Woman Seated beside a Vase of FlowersDOI 10.1175/bams-d-25-0004.1
- Turbulent scaling law in Ogata Kōrin's Red and White Plum BlossomsDOI 10.1063/5.0259486
- Multifractal luminance and aesthetic complexity in van Gogh's paintingsDOI 10.1063/5.0307352