
Paperis Articles
The Golden Ratio — Answers That Moved with the Question, a Different Rectangle for Each Person
In experiments testing the belief that the golden ratio is the most beautiful proportion, answers shifted with the order of the options and the wording of the question; each person's favorite rectangle stayed similar over time but differed from person to person.
Your field's papers, as audio
Pick your fields and journals — Paperis summarizes the key papers and turns them into audio. Listen on your commute.
Start Paperis free →The Golden Ratio — Answers That Moved with the Question, a Different Rectangle for Each Person
The Story That a Single Ratio Decides a Masterpiece
The question tying together a skeleton, a temple, and a famous painting into a single ratio also appears in classrooms. A piece published in a 2007 middle school mathematics teacher's magazine begins like this. What do our skeletons, nature, Greek sculptures, the Parthenon, and Leonardo da Vinci's paintings share mathematically? The title of the piece points to the answer. It is "Are We Golden? Exploring with the Golden Ratio". Borrowing a book to help find that answer, the author writes that connecting mathematics with other school subjects is probably one of the most important instructional goals (DOI: 10.5951/mtms.13.3.0150). It is a piece written for teaching, not a research paper. This writing does not judge beauty, but it shows that the story tying together a skeleton, a temple, and a famous painting with a single ratio has even reached the classroom.
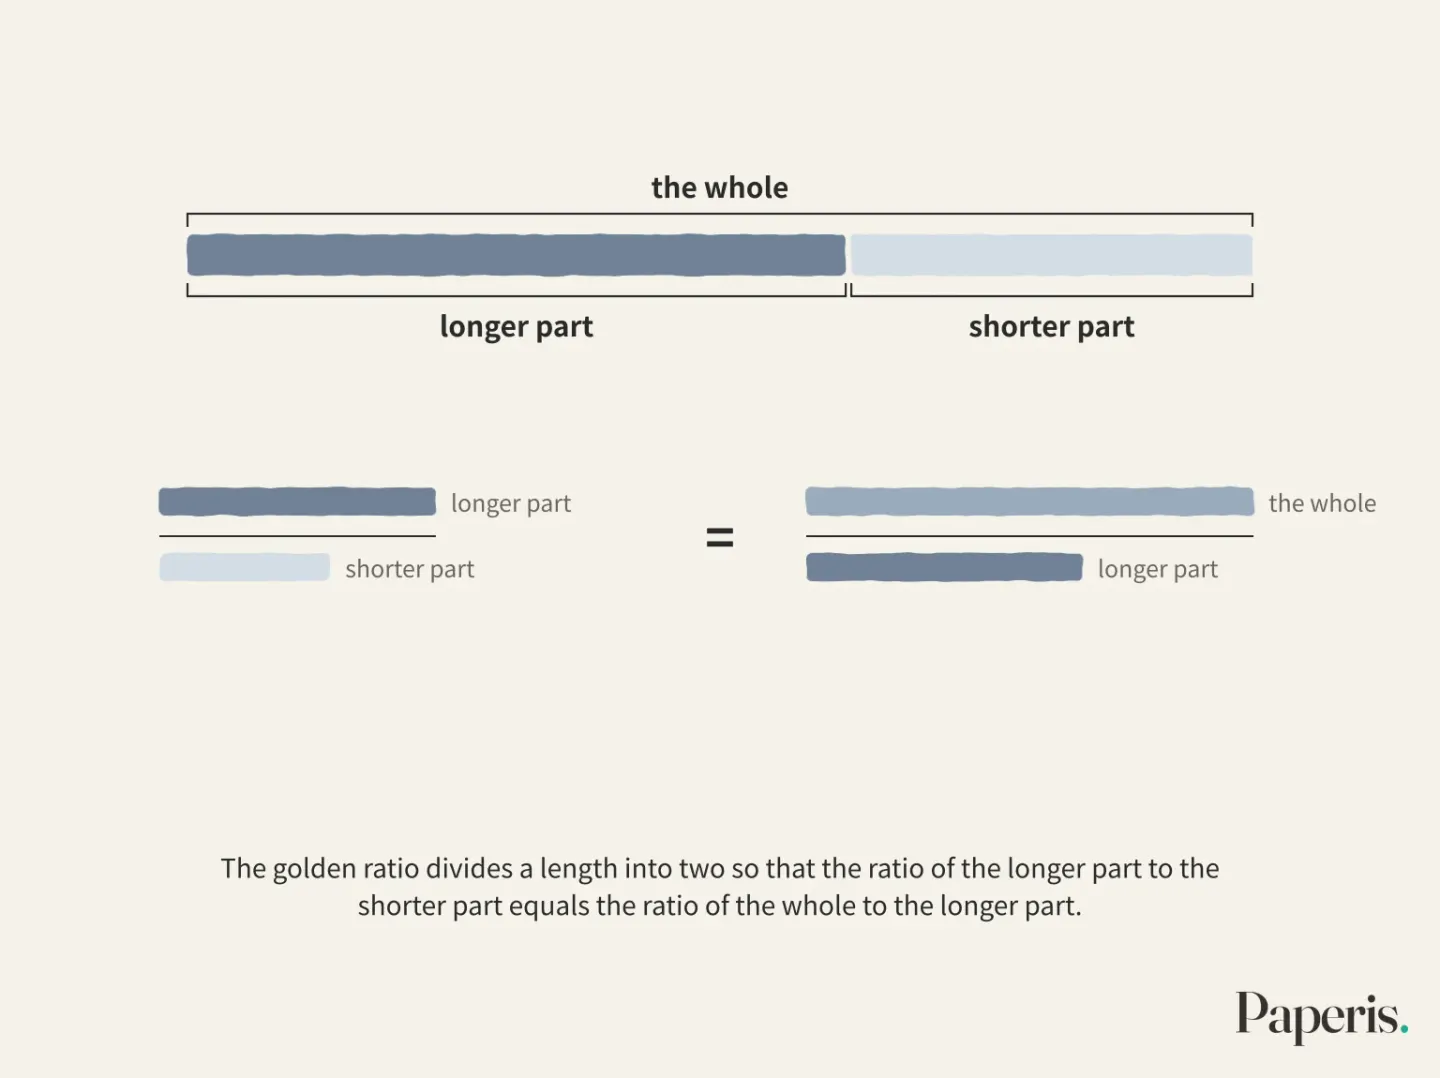
That ratio is the golden ratio. The golden ratio is a ratio obtained by dividing a length into two such that the ratio of the longer part to the shorter part equals the ratio of the whole to the longer part, which is roughly 1.6 to 1. Putting the belief that this ratio is the most beautiful to the test was an even stronger claim. The German writer Zeising claimed that the golden ratio determines the beauty of great art, and when the German scholar Fechner tested this claim through experiments in 1876, it marked the beginning of research questioning the aesthetics of rectangles through experiments (DOI: 10.1037/a0017316). In the late 19th century, this is where Fechner, counted as one of the founders of experimental psychology, began experiments measuring beauty (DOI: 10.1163/187847510x516412). He was drawn to the idea that a single mathematical ratio directly aligns with visual appeal, and that idea matched his research direction that the physical properties of a stimulus and the feeling it evokes form a pair (DOI: 10.2190/uhtq-cfvd-cau2-wy1c).
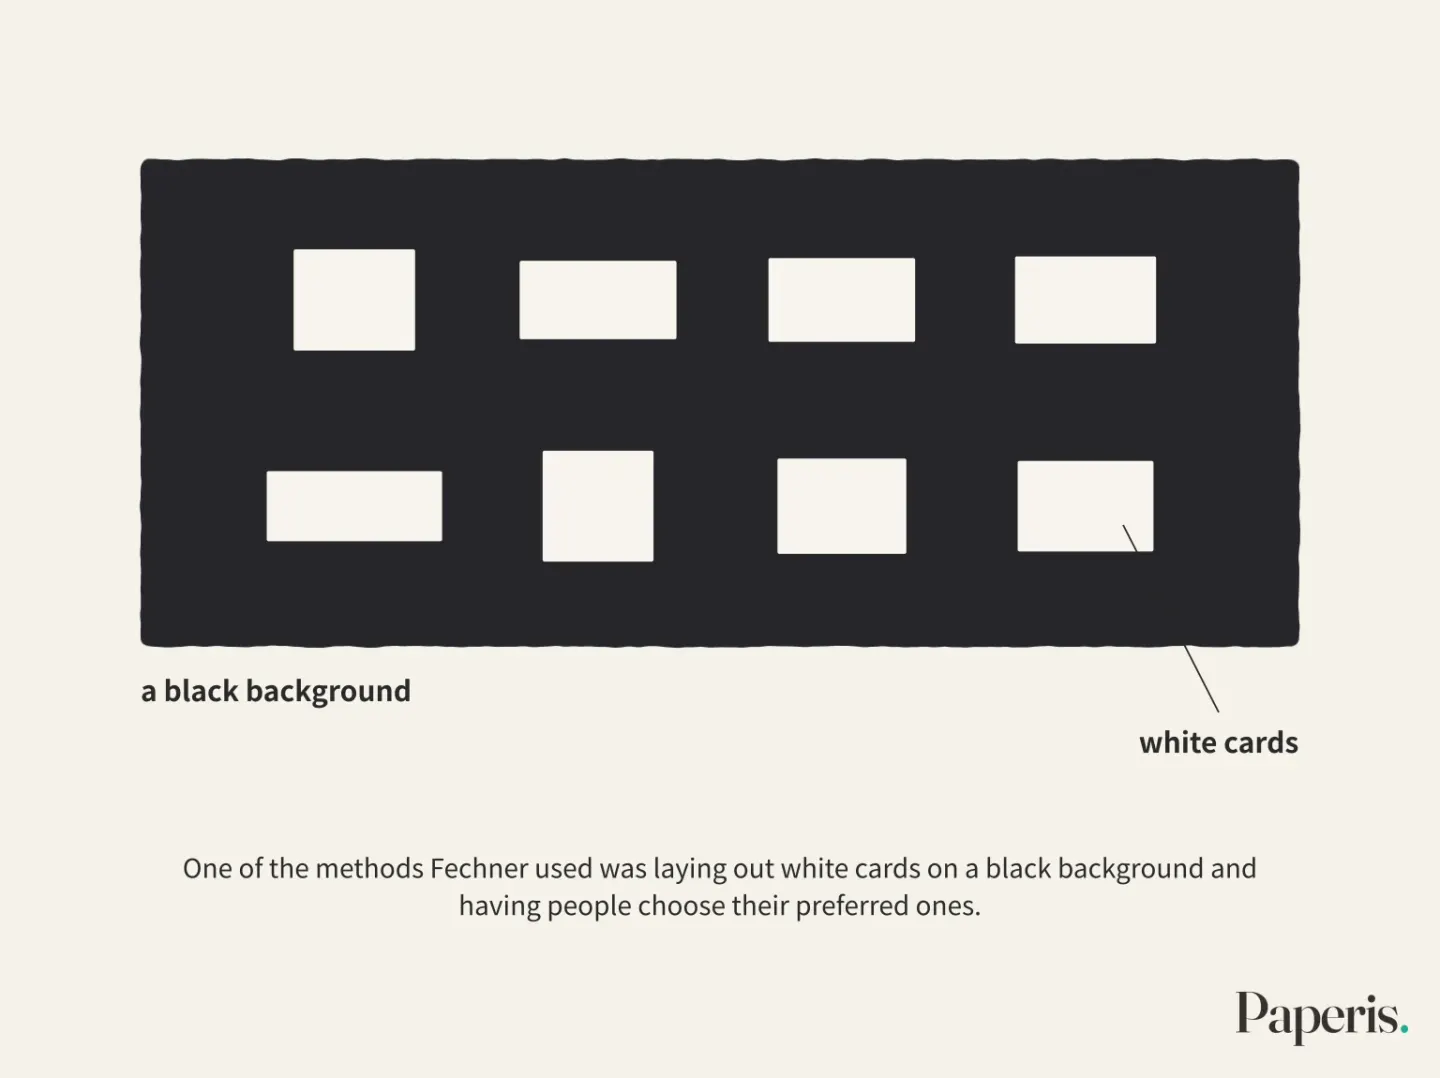
One of the methods Fechner used was laying out white cards on a black background and having people choose their preferred ones, and the preferences he reported rose neatly toward the golden ratio (DOI: 10.2190/2pnh-8tt0-emc5-ftw5). To use the wording from a 2010 study, the role of the golden ratio in acting as a norm for rectangle preference in subsequent experiments has been small (DOI: 10.1037/a0017316).
The primer "Space and Scale — The Seat with Its Back to the Wall, Facing the Window" reviewed this century of pro-and-con experiments, seeing up to the point in one section that the evidence that the golden ratio is beautiful to everyone is weak, while the result that preferred rectangles clearly differ from person to person is more solid. Here, we follow beyond that. We look at which setups and which questions the answers came from, what remains when Fechner's setups are reset or moved to everyday objects, how researchers tried to measure and explain the preferences that differ for each person, and how architectural history writings handle the story of the golden ratio within buildings.
The Way Things Are Arranged Moves the Answer
The 1976 experiment seen in the primer placed the same golden ratio rectangle near the elongated end of a group, in the middle, and near the blunt end. Under the condition of seeing the rectangle for the first time and the condition of having seen it in advance in the previous experiment, 90 participants most frequently chose the rectangles at both ends of the group first, and the golden ratio was picked the most only under the condition where the previous experiment reinforced that side (DOI: 10.2466/pms.1976.43.1.47). The two terms in the paper's title are the names of the traps we will follow in this section. The stimulus range effect is the phenomenon where the width of the options shown together and the position where an option is placed within that width change the degree to which people choose that option. Demand characteristics are clues in the experimental procedure that make participants guess what the experiment wants and answer in that direction. The authors concluded that the golden ratio preference arose as a byproduct created by these two rather than from the aesthetic properties of the rectangle itself (DOI: 10.2466/pms.1976.43.1.47).
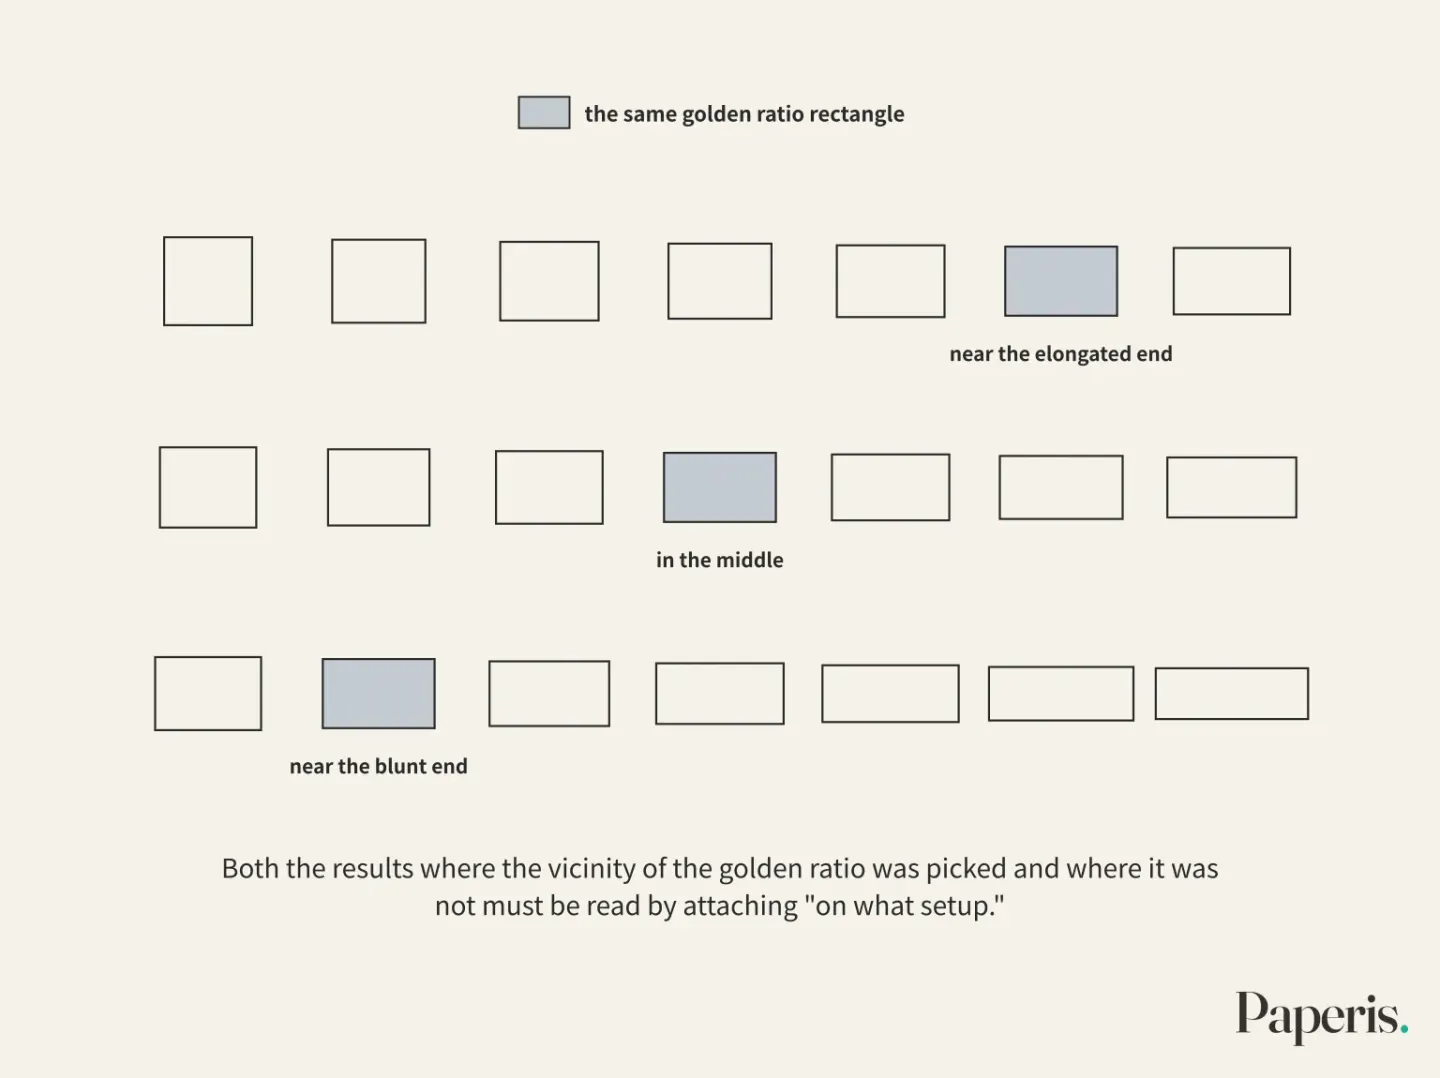
The order in which the groups were shown was also tested separately. A 1997 experiment showed three groups of rectangles with different widths in three orders. Order shook preference the most when the group seen first consisted of slender rectangles. On the other hand, when the group seen first consisted of thick rectangles or a group with the golden ratio right in the middle, the most favored ratio was near the golden ratio (DOI: 10.2190/3x67-cubd-vdgn-ty3d). In this experiment, the vicinity of the golden ratio did not disappear. However, the condition "when which group was seen first" is attached to that result.
What also changes together when changing the ratio is the condition. In another 1976 experiment seen in the primer, large rectangles were picked in a group where size increased along with the ratio, and the vicinity of the golden ratio was picked in a group matched for equal area (DOI: 10.2307/1421471). Both the results where the vicinity of the golden ratio was picked and where it was not must be read by attaching "on what setup."
When the Question Changes
Even if you keep the setup the same and change only the question, the answer shifts. Two experiments published in 2000 had participants directly stretch and shrink the side of a rectangle to make the shape they liked best. When asked to judge based on "how interesting it is," people made rectangles with more extreme side ratios than when judging based on "how good it looks" or "how much they like it." When asked to make it not just any rectangle, but the shape of a single painting or a kitchen tile, they shifted to less extreme ratios than when making a rectangle without any context. The authors discussed what this result means when reading experiments that look for special meaning in specific ratios like the golden ratio (DOI: 10.2307/1423459). An interesting rectangle and a good-looking rectangle were not the same rectangle, and a rectangle to be used as a tile and a rectangle that is nothing were also not the same rectangle.
A 1995 study conducted two experiments. One experiment followed Fechner's drawing method, having participants draw rectangles directly, while the other experiment had them choose and divide already made rectangles. The researchers handed participants judgment criteria phrased in different words. When the criteria differed, the ratio of the drawn rectangles and the ratio of the chosen and divided rectangles also differed. A preference for the golden ratio did not appear in either method. The authors interpreted that preference judgment appears to be the result of processing two pieces of information together: the appearance of the stimulus right in front and the concept in that person's head (DOI: 10.2190/uhtq-cfvd-cau2-wy1c).
There are also experiments that changed both the question and who was asked. A 1994 experiment gave two instructions to people who had not studied art separately and to art school students. When asked to rate "how much I personally like it," the average rating of the people who had not studied art was highest near the golden ratio, and the average of the art school students was highest at the square. When asked to rate "how good the proportion is, regardless of my taste," the averages of both groups tilted clearly toward the square. The preference curves of individual people partly followed the shape of this average, but the differences between people were large. People who had not studied art rated their own preferences more consistently than art school students did (DOI: 10.2190/rmem-k5kl-r2rn-7a2y). The peak near the golden ratio appeared in this experiment under only one group and one instruction.
What these three studies tell us together is that when asking for "the most beautiful ratio," what is being asked is already part of the answer. "Interesting," "good-looking," and "well-composed" are not the same question, and people produce different rectangles in tune with those differences. The problem of conditions in preference experiments continues with different shapes in "Curves — The Pull at First Glance, and the Conditions That Follow".
Setting Fechner's Table Again
If the setups and questions shake the results like this, a remaining method is to set the table that Fechner laid out all over again. A paper published in 1997 titled "The golden ratio hypothesis: A last funeral" did just that. The researcher saw that because vastly different results had piled up regarding the golden ratio hypothesis, Fechner's original experiment had to be revived as faithfully as possible. He used cards of the same ratios as Fechner, placing white cards on a black background. However, Fechner's report was not very meticulous, so other details could not be matched identically, and therefore he ran three experiments with slightly different methods. Under whichever condition they chose from, the golden ratio failed to be the most frequently picked ratio (DOI: 10.2190/2pnh-8tt0-emc5-ftw5).
The researcher attached limitations to his own conclusion as well. Because this study was compared with Fechner's results, it took on the character of a quasi-experiment, and he wrote that the strength of the conclusions he could draw was therefore limited. At the same time, he stated that the attractive peak near the golden ratio reported by Fechner appeared to be a byproduct created by the experiment or the effect of yet-unknown factors. As candidate factors, he discussed two possibilities: that tastes may have changed over time, and that the color of the card paper may have been different. The conclusion was that the golden ratio hypothesis is a myth (DOI: 10.2190/2pnh-8tt0-emc5-ftw5). "Myth" is this researcher's judgment. Supporting that judgment is the result that in the re-set table the golden ratio did not come out ahead, and the limitation that this table was not identical to Fechner's table is also in the same paper.
Another study from 2010 repeated Fechner's experiment while changing the stimuli. Instead of rectangles, it used more natural object shapes, measuring how complex the objects were in various ways and comparing that to preference. The yardstick this study relied on was not the golden ratio, but the complexity of the objects. People liked either very simple objects or very complex objects. This was the opposite of what the researchers expected, but it was a result with a consistent rule. The authors concluded that while there are likely useful yardsticks for measuring aesthetic preference, defining the parts that make up those yardsticks will be difficult and thus things will get complicated (DOI: 10.1163/187847510x516412).
Moving Off the Table and Onto the Mantelpiece
Whether results on a card can be transferred to real-world objects is a separate question to be asked. Ecological validity is the degree to which results obtained in a laboratory match real-world objects and choices.
A 1997 study ran three experiments with 91, 87, and 73 psychology students. Alongside traditional tasks that involved dividing lines or making rectangles, they used a new task. They showed the outlines and cut-out shapes of vases designed with the golden ratio principle and vases that were not, and had participants place those "vases" on a mental mantelpiece and a physical mantelpiece built in the lab. Across all five tasks, which differed quite a bit in their details, there was no evidence whatsoever that the golden ratio was special, nor was there any general preference for golden-ratio vases. What guided people in placing the vases on the shelf was a drive to find balance, and that balance followed area—in other words, visual "weight"—rather than the shape of the vase. The authors wrote that this result casts serious doubt on extending the conclusions from rectangle studies to actual aesthetic objects and choices (DOI: 10.2190/a64n-12ju-w8eg-503v).
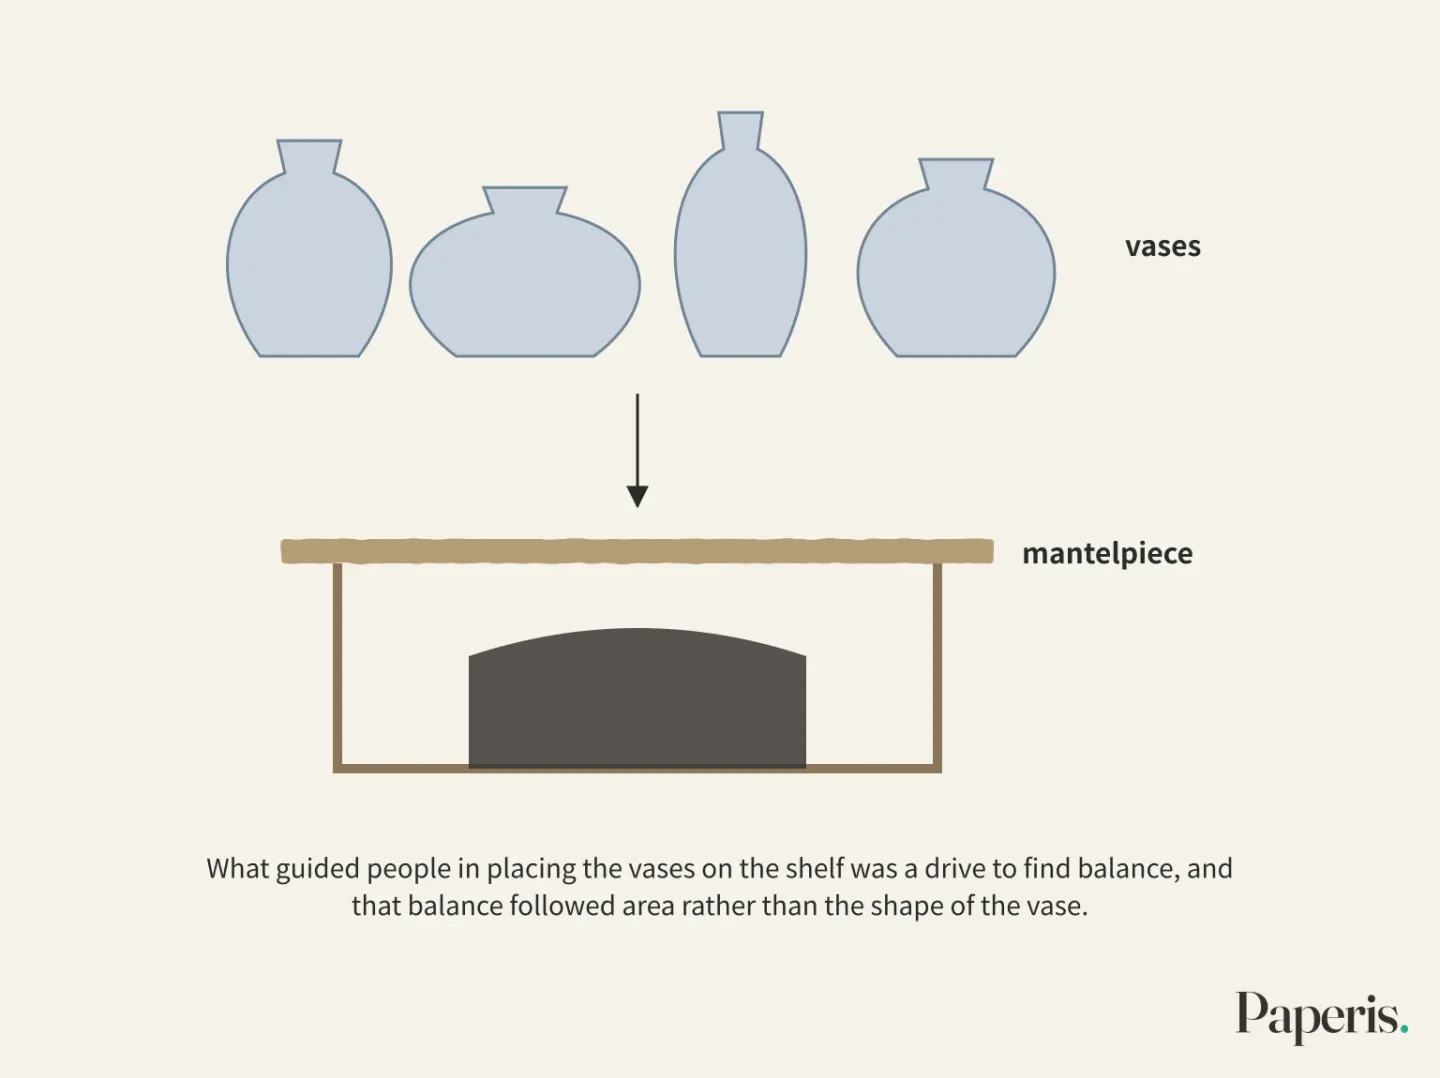
The participants in this study were all psychology students, and the new task was limited to a single setting: vases and a shelf. Even so, this result makes it difficult to assume that peaks on a card translate directly into choices in a room. Whether the golden ratio was pulled from a card or not, taking that result and moving it into rooms and buildings requires an extra step.
The People Hidden Behind the Average
The results up to this point were mostly averages obtained by combining the answers of many people. In 1980, psychologist McManus reviewed prior studies dealing with the aesthetics of rectangles and concluded that the effects shown in those studies were all questionable (DOI: 10.1111/j.2044-8295.1980.tb01763.x) (DOI: 10.1037/a0017316). He stated that this was due to limitations in methods or biases introduced unwittingly by the experimenters, combined with the flaw that most studies looked only at the preferences of the group as a whole while ignoring the different preferences of each individual.
A group preference is a tendency that emerges when the answers of many people are gathered together, and an individual preference is that person's own tendency that reveals itself when a single person answers multiple times. The same paper reported experiments directly measuring individual preferences. One person's preferences were statistically very distinct and stable over time, but they varied to some extent from person to person. When people's preferences were organized through factor analysis, two clear axes emerged. One was an axis centered on the square, and the other was an axis centered on a ratio similar to the golden ratio (DOI: 10.1111/j.2044-8295.1980.tb01763.x). The ratio similar to the golden ratio remained as one of the two axes dividing people's preferences, and the axis toward the square appeared alongside it.
The 2010 study seen in the primer obtained weak group preferences and strong, varied individual preferences again from 79 people, just like McManus's 1980 results. That study showed rectangles on a computer screen and even analyzed the time it took to answer. The response time analysis confirmed that those preferences were consistent judgments. When the preferences were organized, two axes—"square" and "rectangle"—emerged, and people were loaded onto the two axes in different directions and configurations. The researchers broadly measured things that might explain that difference. These were the Big Five personality traits, the degree of enjoyment in thinking, the tolerance for ambiguity, the tendency toward unusual thoughts and perceptions, vocational interest types, and everyday aesthetic activities. None of these had any correlation with rectangle preferences. The authors wrote that while individual differences in rectangle preferences are a solid phenomenon requiring explanation, that diversity remains completely unexplained for now (DOI: 10.1037/a0017316).
Looking only at the average, it is easy to read it as "people are not very interested in the ratio of rectangles." As in the 2010 study, when people are loaded onto two axes in different directions, only a weak tendency may remain in the average that gathers those preferences together. However, conclusions regarding the magnitude of group preferences vary from study to study. A 1997 study noted that prior studies dealing with simple shapes like rectangles and triangles, as well as colors, simultaneously showed clear group preferences and large individual differences (DOI: 10.2190/wwcr-vwhv-2y2w-91ee). "A group's weak preference" and "a single person's strong preference" are different things, and the conclusion that proportions are irrelevant to people does not follow from these results.
That 1997 study expanded the same question to picture composition. It asked where a single object should be placed within a frame to look best. When paired comparisons were used with randomized order, a preference appeared even for the group as a whole. People chose to place the object at the two golden ratio division points horizontally, and between the two division points vertically. At the same time, differences between people were large, just as with rectangles and colors. The researcher proposed a cognitive model suggesting that people perceive continuous things—whether space, shapes, or colors—by dividing them into word categories like "square," "rectangle," and "line," and that preferences diverge among individuals because these categories differ from person to person, with some people liking the center of a category and others liking the boundaries (DOI: 10.2190/wwcr-vwhv-2y2w-91ee). This model is an explanation proposed by the researcher.
The Contested Ground
There are several results in this article where numbers near the golden ratio were chosen. They include the 1978 experiment and the 1976 matched-area groups seen in the primer (DOI: 10.2466/pms.1978.46.3.831) (DOI: 10.2307/1421471), the condition in the 1997 order experiment where thicker groups or the golden ratio group was viewed first, the 1994 subjective evaluations by people without art training, and the 1997 group preferences in composition research. If we erase these results, we establish the opposite conventional wisdom. What these results tell us is that there are setups, questions, and people that select numbers near the golden ratio, and these results do not establish a rule that the golden ratio comes first for all setups and all people.
Results also diverge on the side measuring responses that emerge without time to think. The Implicit Association Test is a task that has people rapidly sort and press keys for pictures and words appearing on a screen, measuring the liking that arises without time to think by seeing which pairings are sorted faster and more accurately. The 2015 study seen in the primer compared setups where the main object within the actual picture was placed at the golden ratio position with setups where it was placed in the exact center (Studies 1 and 2) or at the three-quarters position (Study 3), and found no clear preference for the golden ratio side in either direct ratings or this test. The authors surmised that even if a golden ratio preference exists, it does not seem to happen automatically and may be driven by art expertise, and wrote that this result casts fresh doubt on the universality of the golden ratio preference (DOI: 10.1037/a0038506). Even though it asked about the position of an object within the same picture, this is a different result from the 1997 composition research. The two studies used different methods: paired comparison versus direct evaluation and the Implicit Association Test.
In a 2024 study involving 100 participants, responses were faster and more accurate when golden ratio shapes were paired with positive words, but direct ratings by the same people were mixed. The authors wrote that debate surrounding the golden ratio preference continues (DOI: 10.3390/sym16030333). Because the two studies from 2015 and 2024 differed in pictures, shapes, compared ratios, and task design, neither can be viewed as having overturned the other. Whether there is an attraction to the golden ratio in snap responses remains a contested issue.
The Ruler of the Parthenon
Now we move on to buildings. The Parthenon in Greece, which also appeared in the teaching piece mentioned earlier, is constantly summoned when discussing architectural proportions. A chapter published in 2018 in an edited volume on architectural proportions notes that despite the abundance of analyses on this temple, there is little scholarly consensus regarding the design procedures and measurement units used by the ancients. That chapter records that today, whether proportion is relevant to the beauty of this temple—or indeed of any building at all—faces fundamental doubt, and the author of the chapter calls this situation a crisis of confidence in proportion, placing it alongside the "beauty-proportion problem" defined in the volume's introduction. The author then states that after first addressing that crisis, they will put forward a perspective that re-evaluates the value of proportion (DOI: 10.24415/9789400602878-011).
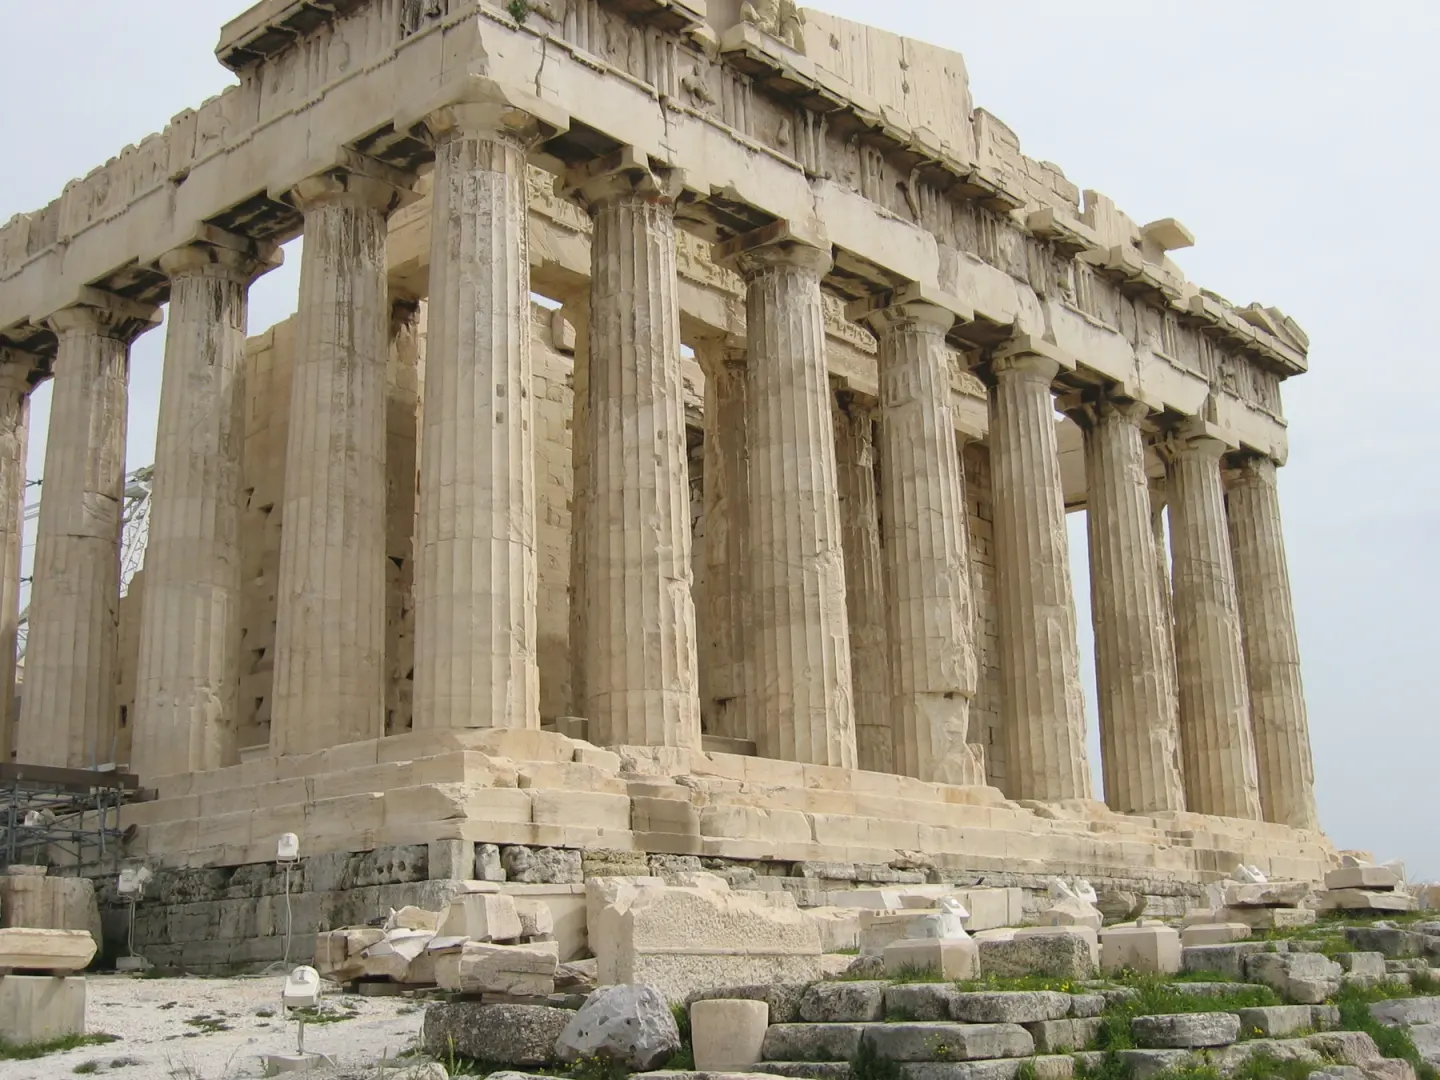
The Parthenon on the Acropolis, Athens · photo: Tim Bekaert · public domain · Wikimedia Commons (photographed in 2005)
The same chapter introduces the position of Matthew Cohen, who wrote the introduction to the volume. Cohen explains the reasons why ratio neither determines nor guarantees beauty, and believes that while historians can study the intentions behind the ancients' use of proportion, they should avoid assigning trans-historical aesthetic value to proportion. The author of the chapter agrees that there is no evidence that a rectangle tailored precisely to an ideal ratio is more beautiful than a rectangle slightly stretched or compressed from that ratio (the example given by the author is a ratio other than the golden ratio). Furthermore, they dismiss the notion that golden ratio rectangles are aesthetically inevitable as mere nonsense. At the same time, the author states that their purpose in writing the chapter is to reveal the surprising organizational fabric of proportions in the Parthenon's design that has not been revealed until now (DOI: 10.24415/9789400602878-011). The author, who called the aesthetic inevitability of the golden ratio nonsense, attempts in the same chapter to show just how intricately organized the proportions of the ancient building are.
Within this evidence, the scope of what can be said about the golden ratio within buildings is limited to this point. Neither the claim that the Parthenon was designed with the golden ratio nor the claim that there is no golden ratio within it can be adjudicated by the evidence gathered in this piece. The lack of consensus on design procedures and measurement units is the state of scholarship summarized by the author of that chapter, and proportion remains a historical research question asking what the ancients intended to do with it. Among the experiments in this piece, the one that came closest to a building was the mantelpiece built in the laboratory. What classical architecture stood upon is followed up in "The Pantheon — A Cracked Bowl That Stands as Arches" through another temple.
Back to the First Question
Fechner laid out white cards on a black background and asked about the golden ratio. The experiments that followed changed those setups one by one. In a 1997 sequence experiment, depending on which batch was shown first, the region near the golden ratio even looked the best. In a 2000 experiment, when participants were asked to make "something interesting," rectangles with more extreme side ratios emerged, and when they were asked to make "something to use as tile," less extreme rectangles emerged. In a 1994 experiment, the average subjective evaluation was highest for squares among art school students, and highest near the golden ratio among people without art training. In a 1997 experiment that reconstructed Fechner's setups as closely as possible, the golden ratio did not take the lead, and in an experiment from the same year where vases were placed on a mantelpiece, people balanced them by area rather than shape.
Studies that looked behind the averages showed a different picture. In a 1980 experiment, individual people clearly chose the rectangles they liked and kept choosing similar ones over time, and in a 2010 experiment as well, personal preferences were strong and diverse. The personality traits and usual aesthetic activities measured by the 2010 study did not explain those differences. While there are results showing that the phrasing of the question shifts the average, and that the averages of art school students and people without art training differed, we still do not know where individual differences come from. The region near the golden ratio was chosen under certain setups, questions, and people, and not chosen in others, and the varying preferences of each individual beneath that remain unexplained. The next time you hear the phrase "This building is beautiful because it was built with the golden ratio," you can ask two things. Who was asked, on what setup, and is there a record that the building was truly designed with that ratio?
Where to Look Further
- Experiments that directly compare proportions inside a building are not found in the evidence gathered by this article. Studies that vary room and elevation proportions in actual spaces or full-scale models serve as the next evidence.
- Where individual differences in square preference come from lies outside the personality and aesthetic activities measured by the 2010 study. How well the categorical model proposed by the 1997 composition study explains those differences is an open question.
- Whether the golden ratio is extracted from the positions of objects in paintings yields conflicting results between the 1997 and 2015 studies, and attraction in split-second, immediate reactions yields conflicting results between the 2015 and 2024 studies. Research repeated with the same stimuli and the same tasks is needed.
Source Papers
- "Beyond the Golden Section and normative aesthetics: Why do individuals differ so much in their aesthetic preferences for rectangles?" (2010) — DOI: 10.1037/a0017316 — A century of experiments since Fechner suggests that the normative role of the golden ratio is small; 79 participants show weak group preferences alongside strong and diverse individual preferences, two factors of “square” and “rectangle”, uncorrelated with individual difference measures such as personality, and diversity is not explained at all.
- "The 'Golden Section': An Artifact of Stimulus Range and Demand Characteristics" (1976) — DOI: 10.2466/pms.1976.43.1.47 — 90 participants, changing the position of golden ratio rectangles across three sets; in the first two conditions, the end rectangles are chosen first, and only under the golden ratio reinforcement condition is the golden ratio the most frequent, leading to the conclusion that it is an artifact of range and demand characteristics.
- "Preference for Proportions as a Function of Context" (1997) — DOI: 10.2190/3x67-cubd-vdgn-ty3d — Three sets in three orders; order effects are maximized when the first set consists of slender rectangles, while top preferences are near the golden ratio when rectangles are stocky or the golden ratio is in the middle.
- "The 'Golden Rectangle': Some New Data" (1976) — DOI: 10.2307/1421471 — Nine cards in six sets, 15 men and 15 women per set; preference for large rectangles when size varies with ratio, and for those around the golden ratio when area is constant.
- "The Aesthetics of Rectangle Proportion: Effects of Judgment Scale and Context" (2000) — DOI: 10.2307/1423459 — Direct adjustment to create shapes; the “interestingness” scale yields more extreme ratios, and picture or kitchen tile contexts yield less extreme ratios than instructions without context.
- "Fechner's Experimental Aesthetics and the Golden Section Hypothesis Today" (1995) — DOI: 10.2190/uhtq-cfvd-cau2-wy1c — Fechner's production and choice methods; different verbal criteria yield different ratios, there is no golden ratio preference under any condition, interpreted as the processing of two pieces of information: stimulus and concept.
- "The Effect of Verbal Instruction and Artistic Background on the Aesthetic Judgment of Rectangles" (1994) — DOI: 10.2190/rmem-k5kl-r2rn-7a2y — Under subjective instructions, the average for non-art majors is near the golden ratio, whereas art school students choose squares; under objective instructions, both lean toward squares, with large individual differences and greater consistency among non-art majors.
- "The Golden Section Hypothesis—Its Last Funeral" (1997) — DOI: 10.2190/2pnh-8tt0-emc5-ftw5 — Fechner's experiment replicated as closely as possible (same ratios, white cards on a black background) across three experiments; the golden ratio is not the top preference, quasi-experimental status limits the strength of conclusions, Fechner's peak is an artifact or unknown factor (taste changes, paper color), concluding that the hypothesis is a myth.
- "Fechner's Aesthetics Revisited" (2010) — DOI: 10.1163/187847510x516412 — Replicated with more natural stimuli; preference for very simple or very complex items (contrary to the hypothesis, but systematic).
- "The Vase on the Mantelpiece: The Golden Section in Context" (1997) — DOI: 10.2190/a64n-12ju-w8eg-503v — 91, 87, and 73 psychology students; no special status for the golden ratio in any of the five tasks, placement on a shelf is determined by balance based on area rather than shape, questioning the generalization of rectangle study conclusions to real objects.
- "The aesthetics of simple figures" (1980) — DOI: 10.1111/j.2044-8295.1980.tb01763.x — Prior effects are all dubious due to methodological limitations and experimenter bias, suffering from a defect of looking only at group preferences; clear and stable yet divergent individual preferences, with two factors of similar ratios for squares and the golden ratio.
- "The Golden Section and the Aesthetics of Form and Composition: A Cognitive Model" (1997) — DOI: 10.2190/wwcr-vwhv-2y2w-91ee — Placement of objects within a frame; groups prefer two horizontal golden section division points and the vertical line between them, with large individual differences, summarizing that previous rectangle studies also showed clear group preferences and large individual differences together, proposing a fuzzy category cognitive model.
- "The Golden Section: The 'True' Ratio?" (1978) — DOI: 10.2466/pms.1978.46.3.831 — Seven rectangles of comparable area, paired comparisons by 120 participants, preferring the golden ratio and its vicinity.
- "Time to let go? No automatic aesthetic preference for the golden ratio in art pictures." (2015) — DOI: 10.1037/a0038506 — Actual paintings, golden ratio versus center (Studies 1 and 2) or three-quarters (Study 3), both explicit and implicit evaluations show no clear golden ratio preference, presuming that art expertise might drive it, questioning universality.
- "Implicit and Explicit Preferences for Golden Ratio" (2024) — DOI: 10.3390/sym16030333 — 100 participants, golden ratio plus positive word pairs are faster and more accurate in an implicit association task, explicit evaluations are mixed, debate is ongoing.
- "10 Approaches to Architectural Proportion and the 'Poor old Parthenon'" (2018) — DOI: 10.24415/9789400602878-011 — Many analyses of the Parthenon exist, but there is little consensus on design procedures or scale units; Cohen states that proportions neither determine nor guarantee beauty and historians should avoid ascribing eternal aesthetic value to them, introduces modern doubts as a “crisis of confidence in proportion” and states an intention to present a new stance on the value of proportion, while the author argues that claims of the aesthetic necessity of golden ratio rectangles are nonsense yet maintains a separate argument for the coherence of Parthenon proportions.
- "Are We Golden? Investigations with the Golden Ratio" (2007) — DOI: 10.5951/mtms.13.3.0150 — Article in a middle school mathematics teachers' magazine (not a study), framing the connection of bone structure, nature, Greek sculpture, the Parthenon, and Da Vinci under a single ratio with mathematics and other subjects as arguably the most important instructional goal (author's personal opinion).
Sources (17)
- Beyond the Golden Section and normative aesthetics: Why do individuals differ so much in their aesthetic preferences for rectangles?DOI 10.1037/a0017316
- The 'Golden Section': An Artifact of Stimulus Range and Demand CharacteristicsDOI 10.2466/pms.1976.43.1.47
- Preference for Proportions as a Function of ContextDOI 10.2190/3x67-cubd-vdgn-ty3d
- The 'Golden Rectangle': Some New DataDOI 10.2307/1421471
- The Aesthetics of Rectangle Proportion: Effects of Judgment Scale and ContextDOI 10.2307/1423459
- Fechner's Experimental Aesthetics and the Golden Section Hypothesis TodayDOI 10.2190/uhtq-cfvd-cau2-wy1c
- The Effect of Verbal Instruction and Artistic Background on the Aesthetic Judgment of RectanglesDOI 10.2190/rmem-k5kl-r2rn-7a2y
- The Golden Section Hypothesis—Its Last FuneralDOI 10.2190/2pnh-8tt0-emc5-ftw5
- Fechner's Aesthetics RevisitedDOI 10.1163/187847510x516412
- The Vase on the Mantelpiece: The Golden Section in ContextDOI 10.2190/a64n-12ju-w8eg-503v
- The aesthetics of simple figuresDOI 10.1111/j.2044-8295.1980.tb01763.x
- The Golden Section and the Aesthetics of Form and Composition: A Cognitive ModelDOI 10.2190/wwcr-vwhv-2y2w-91ee
- The Golden Section: The 'True' Ratio?DOI 10.2466/pms.1978.46.3.831
- Time to let go? No automatic aesthetic preference for the golden ratio in art picturesDOI 10.1037/a0038506
- Implicit and Explicit Preferences for Golden RatioDOI 10.3390/sym16030333
- 10 Approaches to Architectural Proportion and the 'Poor old Parthenon'DOI 10.24415/9789400602878-011
- Are We Golden? Investigations with the Golden RatioDOI 10.5951/mtms.13.3.0150